February 2026 Real Estate Market Update: A Season of Shift 🏡
The Greater Toronto Area (GTA) resale housing market in February 2026 was characterized by tightening conditions, as a significant drop in new listings outpaced the decline in home sales. While overall sales volume decreased by 6.3% year-over-year, new listings saw a much sharper decline of 17.7%.
Wondering how the recent market shift has impacted your property’s bottom line? Get an instant update on your equity here: Free Home Evaluation 📈
Key Market Statistics
Average Selling Price: $1,008,968 (down 7.1% from February 2025).
A quick-reference guide for your readers to see exactly where average prices landed in February 2026. It showcases the price hierarchy from Detached homes at $1,325,654 down to Condo Apartments at $626,650. This is an essential “anchor” visual for any market update.
Thinking of moving this spring? Step one is knowing your numbers. Start your journey with a FREE Professional Home Evaluation today! 🏠
Total Home Sales: 3,868 reported transactions.
New Listings: 10,705 properties entered the market.
This chart highlights the most significant trend of the month: the massive drop in new supply. While sales dipped by 6.3%, new listings plummeted by 17.7%. This visual clearly shows that while the market is “slower,” the lack of inventory is actually tightening market conditions.
With new listings down 17.7%, your home has less competition than it did last year. See what your home is worth in today’s tight market: Quick Home Values ✨
Price Index: The MLS® Home Price Index (HPI) Composite benchmark dropped by 7.9% year-over-year.
This chart focuses on the MLS® Home Price Index (HPI), which tracks the value of a “benchmark” home. I’ve highlighted the Durham Region specifically—with its 7.05% year-over-year dip , it is actually performing better (retaining more value) than the City of Toronto (-9.34%) or Peel Region (-9.58%).
The Durham market is moving fast—don’t rely on old data. Get a real-time valuation of your home based on February’s latest sold prices: Click Here 🔍
Regional & Property Performance
While the overall market is adjusting, Durham Region is showing some fascinating resilience in specific sectors. Here is the year-over-year price index change for February 2026:
Overall Market (Composite): Down 7.05%. with detached homes down 6.74% and apartments down 11.75%.
Detached Homes: Down 6.74%. Remained the most expensive segment with a GTA average of $1,325,654.
Single Family Attached: A surprising increase of 7.77%, showing strong demand for this specific segment.
Townhouses: Down 8.76%.
Condo Apartments: Saw the largest adjustment at -11.75%. Saw the largest volume of sales in the City of Toronto (733 sales) with a GTA-wide average price of $626,650.
TRREB analysts suggest that over 100,000 potential buyers are currently on the sidelines waiting for prices to stabilize and trade conditions to improve. If inventory levels remain low through the spring, increased competition is expected to drive a recovery in both sales and prices during the second half of 2026
With over 100,000 buyers currently waiting on the sidelines, now is the time to beat the rush. Secure your spot in the market today: Search Homes Now 🏃♂️
The latest figures from the Toronto Regional Real Estate Board (TRREB) are in for February 2026, and the data reveals a market that is undergoing a notable recalibration. While the pace of activity has softened compared to last year, the tightening of inventory is creating a unique dynamic for both buyers and sellers.
Is 2026 your year to sell? With experts predicting a surge in the second half of the year, find out your starting point now:Free Evaluation ⏳
The Big Picture: Sales and Pricing Trends
The headline story this month is a pull-back in overall volume. Home sales across the region totaled 3,868, representing a 6.3% decrease compared to the 4,127 sales recorded in February 2025.
This cooling trend is also reflected in property values. The average selling price for a home now sits at $1,008,968. This is a 7.1% dip from the February 2025 average of $1,086,586. For savvy buyers, this price adjustment may offer a strategic window of opportunity that wasn’t available during the peaks of the previous year.
Average prices have adjusted by 7.1% compared to last year. Find the best deals in your favorite neighborhood before they’re gone: View Current Listings📉
Breakdown by Property Type
Understanding the market means looking at the specific segments where you live and shop. Here is how the average prices and sales volume shook out this February:
Property Type
Average Selling Price
Total Sales Volume
Detached
$1,325,654
1,683 Sales
Semi-Detached
$1,027,376
336 Sales
Townhouse
$844,862
698 Sales
Condo Apartment
$626,650
1,088 Sales
Don’t let low inventory stop you! New listings are hitting the market every day. Browse the freshest Durham Region homes for sale right here:Start Your Search 🕵️♂️
The Inventory Crunch: New Listings on the Rise?
Perhaps the most significant statistic this month is the sharp decline in new inventory. There were only 10,705 new listings brought to market in February, a substantial 17.7% drop from the 13,004 listings seen in the same month last year.
This scarcity of new options is a critical factor for anyone planning a move. With fewer homes entering the market, competition for well-priced, high-quality listings remains steady.
Looking for a detached home or a sleek condo? Filter your search by property type and price to find your perfect match: Custom Home Search 🏢
The Sales-to-New-Listings Ratio (SNLR) is a key indicator used to determine if we are in a “Buyer’s,” “Seller’s,” or “Balanced” market.
February 2026: 36%
February 2025: 32%
Interestingly, even though total sales are down, the ratio has actually increased to 36%. This means that while fewer people are buying, even fewer people are selling, which effectively keeps the market from swinging too far into “Buyer’s Market” territory.
Your next chapter starts with a single click. Explore every active listing in the GTA and Durham Region on my easy-to-use portal: GeraldLawrence.Realtor/Search🥂
What This Means for You
For Sellers: Low inventory is your greatest ally. With 17.7% fewer homes to compete against, your property has a better chance of standing out, provided it is priced correctly for the current $1M+ average environment.
For Buyers: The 7.1% decrease in average price is a welcome relief. However, with fewer new listings hitting the wire, you’ll need to be decisive and have your financing in order to move quickly when the right home appears.
The real estate market inside scoop for the community you love. See homes that are for sale and have recently sold. Find out if home sales in your neighbourhood are trending up or down. See what homes around you are currently selling for.
The year 2025 began not with a bang of renewed activity, but with a quiet, persistent rustle of spreadsheet calculations echoing across the Greater Toronto Area (GTA). In a small, two-bedroom rental in Leslieville, Sarah and Mark—a couple in their early thirties—stared at a closing statement for a mid-sized townhouse in Durham Region that they had finally decided not to sign. Despite the Bank of Canada’s aggressive rate-cutting cycle, which saw the overnight rate retreat to 2.25% by late October, the fundamental math of the Toronto dream had changed. For Sarah and Mark, the relatable scenario was one of “cautious hesitation,” a sentiment shared by thousands of prospective buyers who found that even as borrowing costs eased, the cumulative weight of years of inflation on groceries and essentials had permanently altered their debt-service ratios. This was the year of the Great Rebalancing—a period where the emotional urgency of the pandemic era was replaced by a disciplined, strategy-first approach to property.
For sellers, the narrative was equally transformative. Consider the Hendersons in Uxbridge, who had watched their neighbors sell for record highs in 2022. Listing their detached home in early 2025, they were forced to confront a market where “active listings” had surged to levels not seen since 2009. Instead of a weekend bidding war, they faced an average of 31 to 34 days on the market and buyers who insisted on home inspections and financing conditions. This report serves as a definitive professional autopsy of the 2025 market, designed to provide institutional-grade clarity for buyers seeking entry, sellers navigating a reset, and renters finding their first real taste of leverage in a decade. By synthesizing thousands of data points from the Toronto Regional Real Estate Board (TRREB), the Massachusetts Institute of Technology (MIT), and federal housing agencies, this analysis establishes the 2025 market as a foundational pivot toward a more predictable, yet structurally different, 2026.
The Macroeconomic Crucible: Navigating Trade Headwinds and Fiscal Shifts
The performance of the GTA housing market in 2025 was fundamentally underpinned by a broader Canadian economy grappling with what the Bank of Canada described as a period of “subdued growth”. The national landscape was marred by trade uncertainty, particularly regarding widespread U.S. tariffs on steel, aluminum, and automotive sectors—industries that form the backbone of Southern Ontario’s industrial base. Real GDP for Canada contracted by 1.6% in the second quarter of 2025, a shock primarily attributed to declining exports and a pullback in business investment. This cooling at the federal level trickled down to the provincial economy, where Ontario’s real GDP growth was projected to decelerate to a modest 0.8% for the year.
For the real estate professional, these figures were more than just abstract statistics; they were the primary drivers of consumer confidence. The Toronto Census Metropolitan Area (CMA) faced a persistent labor market lag, with an annual unemployment rate standing at approximately 9.4% by the fourth quarter—a figure significantly higher than the national average of $6.9\%$. This disparity created a “confidence gap” where, despite falling mortgage rates, many households were reluctant to commit to long-term financial obligations while the industrial and manufacturing sectors faced structural headwinds.
Monetary Policy and the Affordability Paradox
The Bank of Canada’s monetary response was the primary catalyst for market stabilization. By October 29, 2025, the benchmark rate had been cut to 2.25%, a cumulative drop of 2.75% from the 5.0% peak seen in early 2024. This led to a significant easing in the mortgage landscape, with five-year insured fixed rates dipping as low as $3.69% and variable rates hitting 3.45%. However, the anticipated “flood of buyers” failed to materialize in the first half of the year. The reason, as analyzed by TRREB and Ipsos, was that while interest rates were falling, home prices had not yet corrected enough to offset the increased cost of living.
Economic Indicator
2025 Full Year (Estimated)
2024 Full Year (Actual)
Impact Direction
Canada Real GDP Growth
0.75%
1.1%
Negative/Slowing
Ontario Real GDP Growth
0.8%
1.4%
Negative/Slowing
Toronto Unemployment Rate
9.4%
8.2%
Negative/Rising
BoC Overnight Rate (Year-End)
2.25%
5.0%
Positive/Falling
CPI Inflation (Ontario Avg)
1.9%
2.4%
Positive/Stabilizing
The analysis suggests that 2025 was the year the “Pressure Point”—the intersection of housing supply, migration, and the missing middle—became the central focus of policymakers. While inflation moderated to near the 2% target, the cumulative effect of the previous years’ price surges left household budgets permanently elevated. Groceries remained 25%-30% more expensive than in 2019, and GTA rents had climbed 40% over the same period, creating a “trap” for renters who wished to save for a down payment but were consumed by monthly carrying costs.
The Migration Phenomenon: The Erosion of the Urban Premium
A defining characteristic of 2025 was the acceleration of outmigration from the GTA. Excluding international immigration, the region lost an average of 80,000 residents annually to other parts of Ontario and the rest of Canada. This movement was not merely a lifestyle choice but a fiscal necessity. The “urban premium”—the idea that living in Toronto was worth the exorbitant cost for the sake of proximity to jobs—began to dissolve under the weight of remote work and infrastructure failure.
The Cost of Congestion and Infrastructure Stagnation
For the average professional, the GTA’s infrastructure became a primary driver of relocation. Toronto’s traffic congestion was ranked among the worst in North America, with drivers losing approximately 118 hours each year to delays. This was not just a frustration; it was an economic drain, costing the region roughly $44.7 billion annually in combined social and economic losses. Ipsos polling indicated that 53% of residents had considered leaving the GTA specifically because of gridlock.
The normalization of remote and hybrid work provided the “escape hatch” residents needed. By late 2024, 28.8% of the Toronto labor force worked in a hybrid or fully remote capacity. This enabled a mass exodus of young families and professionals to more affordable communities where they could access larger living spaces without sacrificing their Toronto-based salaries.
The Alberta and Small-Town Ontario Allure
The financial incentive to relocate was most apparent when comparing the carrying costs of homeownership across Canadian jurisdictions. A household moving from Toronto to Calgary or a mid-sized Ontario city like Uxbridge or London found immediate relief in lower property taxes and the absence of a municipal land transfer tax.
Ownership Cost Factor
City of Toronto
City of Calgary
City of Mississauga
Avg. Home Price (Sept 2025)
$1,089,918
$615,005
$969,501
Res. Property Tax Rate
0.7541%
0.6180%
1.0338%
Estimated Annual Tax
$8,219
$3,990
$9,950
Land Transfer Tax (LTT)
Double (Prov + Mun)
No LTT (Title Fee Only)
Single (Prov Only)
The evidence indicates that a Toronto homeowner pays roughly double the annual property tax of a comparable Calgary homeowner, while a Mississauga homeowner pays nearly three times more. This recurring financial burden, when layered onto elevated mortgage and utility costs, became a primary catalyst for outmigration among the 66% of young Ontarians (aged 18-34) who expressed a desire to leave the region.
Residential Segments: A Tale of Two Markets
The 2025 residential market was a study in contrasts, characterized by a resilient but normalizing freehold sector and an oversupplied, investor-strained condominium segment.
Freehold Resilience: The Detached and Semi-Detached Reset
Detached homes remained the most coveted asset class in 2025, but they were not immune to the broader market rebalancing. The average price for a detached home in the GTA fell by 5.2% to approximately $1,379,666. This correction was seen by industry professionals as a “reset” rather than a “crash.” Sellers who recognized the shift toward balanced conditions and priced their homes accurately continued to find success, while those anchored to 2022 expectations saw their properties sit for months.
Semi-detached homes and townhouses proved slightly more resilient, with semi-detached prices declining by a more modest 4.5% to $1,050,605. The growth in new listings for these segments—up 17.3% for semi-detached and 9.3% for townhouses—provided move-up buyers with a level of choice that had been absent for the better part of a decade.
The Condominium Crisis: Inventory at a Crossroads
The condominium apartment segment faced the most significant challenges in 2025. Sales volume for condos dropped by $14.7\%$ year-over-year, while the average selling price fell by 5.1% to $667,235. The sector was impacted by a “perfect storm” of factors:
High Listing Inventory: Active listings in the condo segment reached historic highs, giving buyers unprecedented negotiating power.
Investor Pullback: As average rents trended lower and short-term rental regulations tightened, many investors found their units to be cash-flow negative, leading them to list properties rather than continue to hold.
The First-Time Buyer Gap: Despite being the most affordable housing type, Ipsos polling found a persistent gap of approximately $600 between what typical renter households could afford for a monthly mortgage and the actual cost of a condo unit.
Housing Type
2025 Avg. Price
2024 Avg. Price
Price Change (%)
Sales Change (%)
Detached
$1,379,666
$1,456,039
-5.2%
-10.6%
Semi-Detached
$1,050,605
$1,099,883
-4.5%
-3.3%
Townhouse
$876,354
$922,207
-5.0%
-12.4%
Condo Apartment
$667,235
$702,943
-5.1%
-14.7%
The data suggests that the condo market in 2025 became a “buyer’s playground,” where offer conditions and price negotiations replaced the bidding wars of the past. For buyers like Sarah and Mark, this segment finally offered a point of entry, provided they were willing to navigate the complexities of high maintenance fees and building-specific financials.
Policy and Planning: The Multiplex Zoning Experiment
One of the most profound shifts in the Toronto planning landscape occurred in May 2023, when the city adopted a citywide zoning reform allowing two- to four-unit residential buildings (“multiplexes”) as-of-right. In 2025, researchers from MIT’s Centre for Real Estate published an exploratory assessment of how this policy was being reflected in land values.
MIT Research Findings on Land Value
The analysis, which utilized approximately 65,700 improved freehold sales within Toronto between 2018 and 2025, sought to determine if the “optionality” of building a multiplex was being priced into the market.
Larger Lots: The study defined “larger lots” as those with a frontage of at least 30 feet or an area of at least 3,000 square feet. These lots represent roughly 85% of the transactions in Toronto’s low-rise neighborhoods. Price Signal: The baseline model estimated a modest 1%-2% relative price increase for larger lots following the reform.
The Anticipation Effect: A critical insight from the MIT research was that the price gap between larger and smaller lots began widening as early as 2021-2022. This suggests that the market had already “priced in” the multiplex reform through years of public signals, pilot projects, and policy discussions before the formal bylaw was ever enacted.
The evidence indicates that while zoning reform is a necessary step toward addressing the “missing middle,” the market’s response is gradual and influenced by broader economic factors like construction costs and interest rates. For the homeowner, this means that while their lot might have gained some “redevelopment value,” the ability to realize that value depends on site-specific buildability and current financing conditions.
Fiscal Policy: Tax Relief and the Cost of Development
In a year defined by affordability concerns, governments at all levels were forced to take action. The 2025 Federal Budget and the Ontario Fall Economic Statement introduced several measures designed to lower the barrier to entry for first-time buyers.
The GST/HST Rebate Revolution
Effective May 27, 2025, the federal government introduced a 100% rebate of the 5% federal GST on newly built homes priced up to $1 million for first-time buyers. This initiative was designed to encourage new home construction and provide significant upfront relief—up to $50,000—to buyers. The Ontario government mirrored this at the provincial level, announcing the removal of the provincial 8% HST portion for first-time buyers of new homes effective January 1, 2026. Together, these rebates represent a massive reduction in closing costs for the “missing middle” segment, where new homes often hover between $800,000 and $1.2 million.
The Burden of Development Charges
Despite these tax cuts, the cost of bringing new supply to market in the GTA remained punishingly high. Development charges—fees collected from developers to fund municipal infrastructure—saw significant increases.
Low-Rise Homes: Average charges in the GTA hit $123,649 per unit in 2025, an increase of $42,000 since 2022.
High-Rise Homes: Average charges hit $68,608 per unit, up $32,000 since 2022.
The analysis suggests a stark disparity between the GTA and competing regions like Calgary, where off-site levies averaged just $22,600 per unit. This cost-of-growth imbalance is a primary reason why new home sales slowed in 2025, as developers struggled to maintain project viability while buyers faced reduced purchasing power.
The Rental Market: A Shift in the Balance of Power
For several years, the GTA rental market had been defined by ultra-tight conditions and soaring rents. In 2025, that dynamic began to shift as supply growth met a cooling of demand.
The Vacancy Surge and the “Filtering Effect”
According to CMHC and TRREB reports, the national purpose-built rental vacancy rate rose to 3.1% in 2025, up from 2.2% in 2024. In the GTA, the rental inventory remained historically high due to a wave of condominium completions and the entry of new purpose-built rental units. This surge in supply created a “filtering effect.” As high-end, newly completed units hit the market, landlords were forced to offer incentives like one or two months of free rent to attract tenants. This, in turn, allowed tenants to move from older, less-efficient buildings into higher-quality units without the “rent shock” that had characterized previous moves.
Rental Prices and Negotiating Power
Average rents in the GTA trended lower on a year-over-year basis for the first time in the post-pandemic era. In the second quarter of 2025, average one-bedroom rents were down 5.1% to $2,326, while two-bedroom rents dropped 3.5% to $3,066. The inventory of units listed for rent grew by 16% year-over-year, significantly outpacing the growth in rental transactions. For the renter, this meant that the power dynamic had shifted from the landlord to the tenant. The evidence indicates that even in the secondary rental market (condo rentals), vacancies rose, and owners became more flexible on terms to avoid units sitting empty.
Rental Segment (GTA)
Q2 2025 Avg Rent
Q2 2024 Avg Rent
YoY Change
Bachelor
$1,873
$1,972
-5.0%
1-Bedroom
$2,326
$2,452
-5.1%
2-Bedroom
$3,066
$3,178
-3.5%
3-Bedroom
$3,924
$3,972
-1.2%
The analysis highlights that while permanent residents through immigration helped keep transaction volumes above 2024 levels, the dip in temporary residents—students and temporary workers—removed a significant layer of competition from the bottom of the market.
Regional Deep Dives: The Durham and Uxbridge Micro-Markets
While the broader GTA market felt the weight of 2025’s economic headwinds, certain pockets showed remarkable resilience and localized dynamism. The Durham Region, in particular, became a focus for families seeking the “missing middle” housing that was increasingly scarce in Toronto.
Durham Region: The Competitiveness Leader
In late 2025, Durham Region led the GTA in buyer competitiveness, boasting the lowest average days on market and a sale-price-to-list-price ratio that remained consistently near parity. Despite a 4.8% decrease in average sale prices year-over-year, detached homes in Durham remained stable, averaging just over $945,000 in October. The region’s attractiveness was driven by a combination of affordability and economic momentum. Durham achieved a record $1.23 billion in non-residential building permits in 2023, signaling a robust economic ecosystem that supports long-term property appreciation.
Uxbridge: A Case Study in Market Reset
Uxbridge Township, known for its rural charm and high-value detached homes, provided a clear snapshot of the “normalization” trend.
Year-End Prices: The average sale price in Uxbridge reached $1,190,682 in December 2025, a marginal 0.32% increase from December 2024.
The “Buyer’s Window”: In January 2026, the average price dipped to $996,667, marking the first time in years that the regional average fell below the $1 million threshold.
Inventory Shifts: Active listings in Uxbridge reached 77 in December, a 40% increase year-over-year, while the average days on market climbed to 64 days.
The data from Uxbridge suggests that while the “lifestyle-driven move” remains a priority for many, buyers are now moving at their own pace, performing due diligence, and negotiating terms that reflect the new interest rate reality.
Infrastructure: The Connectivity Catalyst
A critical “third-order” insight for property values in Durham and Uxbridge is the massive investment in transit connectivity.
Durham-Scarborough BRT: Ground was broken in 2025 on the 36-kilometer dedicated bus rapid transit lane, which is projected to reduce travel delays by 85% along the Kingston Road corridor.
Uxbridge Transit Hub: The upgrade of the local hub, integrating smart ticketing and real-time tracking, is scheduled to reduce travel times to Toronto by 20%, significantly enhancing the “commuter value” of homes in the township.
The professional perspective indicates that homes within walking distance of these hubs are positioned for superior long-term appreciation as the region continues to grow toward a projected population of 1.3 million by 2051.
Commercial Real Estate: A Disciplined Holding Pattern
The GTA commercial real estate market in 2025 was a story of “mixed fortunes,” as optimism about improving debt markets clashed with persistent economic uncertainty. Total investment volume reached $2.9 billion in the third quarter, a 6% increase from the previous quarter but still 6% below 2024 levels.
Industrial Dominance
Industrial assets remained the undisputed leader of the commercial landscape, accounting for 51% of all transactions. Investment volume in this sector jumped 22% quarter-over-quarter, driven by a scarcity of high-quality assets. A standout transaction was a $152.5 million self-storage portfolio, which underscored the continued demand for logistical and storage solutions in an urbanizing GTA.
Office and Multi-Residential Challenges
Office investment remained the laggard, down 28% year-over-year. While improved leasing activity offered some hope, the sector continued to struggle with valuation uncertainty. Multi-residential investment also saw a sharp 62% decline from the previous year, although demand for value-add assets remained strong as financing conditions improved. The commercial sector in 2025 was defined by a “disciplined approach,” where investors were extremely selective, focusing on necessity-based assets like grocery-anchored strip malls, which saw a 49% resurgence in deal volume.
Conclusion: Synthesizing the 2025 Experience for the 2026 Horizon
The full year of 2025 represented the most significant structural rebalancing of the GTA real estate market since the 2008 financial crisis. For the first time in a decade, the “fear of missing out” was replaced by “the freedom of choice.” The analysis demonstrates that the 2025 market was not one of collapse, but of “normalization”—a reset that was necessary to create a sustainable foundation for future growth.
For Buyers, 2025 provided the strategic entry window they had been waiting for. More choice, less competition, and improved affordability through both lower mortgage rates and federal tax rebates created a rare moment of leverage. For Sellers, the year was a lesson in realism. Success required a departure from the emotional pricing of the past and a focus on presentation, strategy, and market-accurate valuations. For Renters, the year marked the end of the ultra-tight market. A wave of new supply and a cooling of demand granted them negotiating power and the ability to move into higher-quality housing with incentives.
As we look toward 2026, the evidence suggests that the “Pressure Point” identified by TRREB will remain a central theme. The region’s ability to retain talent and house its growing population depends on continued coordination across all levels of government to streamline development, reduce fees, and incentivize the “missing middle”. For the real estate professional, 2025 was the year we moved from speed to strategy, a shift that will define the winners of the next decade.
Professional Real Estate FAQ: 2025 Year in Review
Is the GTA real estate market currently in a buyer’s or seller’s market?
In 2025, the GTA market shifted into a “balanced” state, with significant pockets of “buyer’s market” conditions, particularly in the condominium and entry-level freehold segments. Inventory reached levels not seen since 2009, granting buyers unprecedented power to include conditions and negotiate prices below list.
How much did home prices actually drop in 2025?
Across the entire GTA, the average selling price for all home types in 2025 was approximately $1,067,968, a decrease of 4.7% from 2024. Detached homes saw the steepest correction at 5.2%, while the condo segment fell by 5.1% due to high inventory levels.
What is the new GST rebate for first-time buyers of new homes?
Introduced in the 2025 Federal Budget, the rebate eliminates the 5% GST for first-time buyers on newly built homes priced up to $1 million. A partial rebate is available for homes up to $1.5 million, providing up to $50,000 in total upfront savings for qualifying purchasers.
Why are so many people leaving the Greater Toronto Area (GTA)?
Outmigration is primarily driven by housing unaffordability, high property taxes, and extreme traffic congestion. Many young professionals and families are using remote work flexibility to relocate to more affordable regions like Alberta or Southwestern Ontario, where the cost of living and property taxes are significantly lower.
Are rents going down in Toronto and the GTA?
Yes, average rents trended lower in 2025 for the first time in several years. Average one-bedroom rents in the GTA fell by 5.1% to $2,326, as a surge in new condominium and purpose-built rental supply gave tenants more choice and negotiating power.
What impact did the multiplex zoning reform have on home values?
MIT research found that Toronto’s 2023 multiplex zoning reform led to a modest 1%-2% relative price increase for “larger lots” (30ft+ frontage). However, much of this value was “priced in” by the market during the policy discussion phase between 2021 and 2022.
How do development charges affect the price of new homes in Ontario?
Development charges in the GTA are among the highest in Canada, averaging $123,649 for a new low-rise home in 2025. These fees have increased by $42,000 since 2022, adding significant upward pressure on the final sale price of new housing supply.
Is now a good time to invest in the Toronto condo market?
The 2025 condo market offered unique opportunities for “value plays,” as high inventory and lower rents pressured some investors to sell. Strategic buyers are finding opportunities in well-located units where supply levels currently allow for deeper negotiations on price and terms.
Durham Region Real Estate Market Update: January 2026 Analysis
The January 2026 real estate data for the Durham Region is in, and it paints a picture of a market in transition. Whether you’re looking to buy your first home or sell your current property, understanding these shifts is crucial for making informed decisions.
Here’s a breakdown of the key stats and what they mean for you:
The Big Picture: Prices and Volume
Average Price: The average home price in Durham for January 2026 was $822,185. This represents a slight dip of 1.9% from December 2025 and a more significant 9.2% decrease compared to January 2025.
Median Price: The median price followed a similar trend, sitting at $776,000, down 1.5% month-over-month and 7.6% year-over-year.
Inventory Surge: We saw a massive jump in new listings, with 1,150 new properties hitting the market—a 107.6% increase from December. However, overall transaction volume remained lower than last year, with 408 sales (down 17.9% YoY).
Days on Market: Homes are staying on the market longer. The average time to sell is now 41 days, up nearly 34% from the same time last year.
What This Means for Buyers
If you’ve been waiting on the sidelines, the January data offers some encouraging news. The market is shifting in a way that gives buyers more breathing room and leverage.
More Choice: The explosion in new listings (up over 100% from last month) means you finally have more inventory to browse. You aren’t forced to compete for the same two or three houses.
Negotiating Power: With nearly 79% of homes selling below the list price and an average Sale Price to List Price (SP/LP) ratio of 97.9%, the “bidding war” era has cooled significantly. Sellers are increasingly open to offers below the asking price.
Time is on Your Side: With homes sitting for an average of 41 days, you have more time to conduct due diligence, schedule second viewings, and ensure the home is the right fit without the pressure of an immediate deadline.
Buyer Strategy: Focus on properties that have been on the market for 30+ days. These sellers may be more motivated to negotiate on price or terms.
What This Means for Sellers
Selling in the current market requires a shift in strategy compared to the highs of early 2025. While prices have softened, the market remains active for well-positioned properties.
Realistic Pricing is Critical: The average list price ($953,844) is significantly higher than the average sale price ($822,185). Overpricing your home in this market can lead to it sitting stagnant, as evidenced by the increase in Days on Market and the 432 terminations seen this month.
Presentation Matters: With more competition (listings) and fewer active buyers (lower volume), your home needs to stand out. Professional staging, high-quality photography, and minor repairs are no longer optional—they are essential to attract serious offers.
Expect Negotiations: Only 17.2% of homes sold above the list price this month. Be prepared for offers that include conditions and come in slightly below your asking price.
Seller Strategy: Price your home according to current sold data, not active listings. A “sweet spot” price will generate interest early, which is vital when buyer attention is spread thin across many new listings.
The Bottom Line
The Durham Region is currently a “Balanced to Buyer-Leaning” market. While prices have corrected from last year’s peaks, the increase in inventory and the slower pace of sales create a more stable environment for everyone involved.
Ready to Make Your Move?
For Buyers: Don’t miss out on the best selection of inventory we’ve seen in months! [Contact me today] for a curated list of homes in your favorite Durham neighborhood and let’s get you a deal below the asking price.
For Sellers: In a competitive market, your strategy is everything. [Click here for a Free Home Evaluation] to see what your property is worth in today’s shifting market and learn how our marketing plan can get your home sold while others sit on the market.
The Uxbridge housing market started 2026 in a cooling phase, characterized by significant year-over-year price corrections and a month-over-month decline. While the long-term trend (2020–2026) shows substantial growth, the current “Latest Reading” suggests a buyer-favorable shift as prices dip below the million-dollar threshold for the first time in several months.
1. Price Performance & Trends
Average Sale Price (Jan 2026):$996,667
Monthly Change: ▼ 1.9% (from Dec 2025)
Yearly Change: ▼ 27.0% (from Jan 2025)
Historical Context: January 2026 ranks 61st out of the last 73 months (bottom 17th percentile). Compared to the pandemic-era peak in February 2022 ($1,565,267), prices have retracted by approximately 36%.
Current Streaks: The market is currently experiencing a sustained cooling period, with 4 consecutive months of month-over-month price declines and 3 consecutive months of year-over-year declines.
2. Comparative Analysis (January YoY)
The current January average is significantly lower than the same month in previous years, highlighting a notable market reset:
vs. 2025: -27.0%
vs. 2024: -13.0%
vs. 2023: -20.5%
vs. 2022: -26.5%
vs. 2021: -24.7%
3. Market Highs and Lows
The Peak: The highest average price recorded in the dataset was $1,565,267 (Feb 2022), followed closely by November 2021 ($1,547,371).
The Floor: The lowest prices in recent years occurred in early 2020, with the bottom hit in March 2020 at $725,916.
Significant Moves: The most aggressive growth in the last 12 months occurred in September 2025, which saw a +32.4% year-over-year jump, a spike that has since been corrected.
4. Seasonal Insights
Data indicates a strong seasonal pattern in Uxbridge:
Highest Prices: Typically peak in May, coinciding with the spring market.
Lowest Prices: Historically found in December, following the late autumn slowdown.
5. Outlook for Buyers and Sellers
For Buyers:
The market currently presents a rare opportunity. With prices down 27% year-over-year and the average price sitting just under $1M, buyers have significantly more leverage than they did during the peak years of 2021–2022. The 4-month downward trend suggests a lack of urgency in the market, allowing for more thorough due diligence and negotiation.
Stop Waiting for the Bottom—You’re Looking at It. With Uxbridge prices dipping below $1,000,000 for the first time in years and year-over-year values down 27%, the “buyer’s market” window is wide open. Don’t wait for the spring rush to bring back the competition. Secure your dream home today while you still have the upper hand in negotiations. View Current Listings Under $1M
Buy the Dip, Not the Hype. Today’s Uxbridge market offers something we haven’t seen since 2020: Choice. With 4 consecutive months of price cooling, you can finally move at your own pace, perform your due diligence, and negotiate terms that work for you. Ready to find a high-value home in a premium community? [Download My Uxbridge Buyer’s Guide]
For Sellers:
The market is in a “down” cycle compared to the highs of late 2025. Sellers should be aware that Jan 2026 represents a low point in recent years (17th percentile). Pricing strategy is critical; properties priced based on 2022 or even early 2025 expectations will likely sit on the market. Strategic listing in the upcoming May peak may be advisable to capture the historical seasonal high.
Don’t Get Lost in the Spring Crowd. While the market is currently quiet, serious buyers are active and looking for quality inventory. By listing now, you capture “The Early Bird” demand before the market becomes saturated in May. Let’s position your home to stand out as the premier choice in Uxbridge. [Get My Professional Valuation]
Is Your Home Ready for the May Peak? History shows that Uxbridge prices consistently hit their highest levels in May. Success in this market requires more than a lawn sign—it requires a data-driven pricing strategy and flawless presentation. Start your 90-day “Success Plan” today to ensure you’re ready to capture top dollar when the market heats up. [Book a Strategy Consultation]
Living, Investing, and Thriving in Durham Region: A Complete Guide to What’s Happening Now
Durham Region continues to stand out as one of Ontario’s most desirable places to live, work, and invest. Located just east of Toronto, Durham offers a rare combination of affordability, community-focused living, economic growth, and access to nature—making it highly attractive to homebuyers, sellers, investors, and families alike.
As a REALTOR® serving Durham Region, staying informed on local events, infrastructure projects, lifestyle trends, and real estate market dynamics is essential. This comprehensive guide explores what’s happening across Durham right now, why it matters, and how it impacts real estate decisions—whether you’re buying your first home, upsizing, downsizing, or investing.
Why Durham Region Continues to Attract Buyers
Durham Region includes Ajax, Pickering, Whitby, Oshawa, Clarington, Scugog, Brock, and Uxbridge—each offering a distinct lifestyle while benefiting from regional growth and connectivity.
Key Reasons Buyers Are Choosing Durham:
Relative affordability compared to Toronto and York Region
GO Transit expansion and improved highway access
Growing employment hubs and post-secondary institutions
Waterfront communities and expansive green spaces
Strong sense of community and family-friendly neighbourhoods
For many buyers priced out of Toronto, Durham provides more space, better value, and long-term appreciation potential.
👉 Learn more about the region directly from Durham Region’s official website: https://www.durham.ca
Major Events and Community Happenings Across Durham Region
Community events play a major role in shaping neighbourhood appeal and quality of life—both important factors for homeowners and buyers.
The Durham housing market has evolved into a balanced, opportunity-driven environment.
Current Market Highlights:
Continued demand for detached and freehold townhomes
Strong interest in bungalows and downsizing options
Increased investor activity in legal duplexes and secondary suites
Buyers prioritizing move-in-ready homes and energy efficiency
Strategic pricing, professional marketing, and strong negotiation skills are more important than ever for sellers. Buyers, meanwhile, benefit from local expertise to identify value and avoid overpaying.
If you’re thinking about buying or selling, understanding micro-market conditions by neighbourhood is critical.
Lifestyle, Recreation, and Green Space
One of Durham’s strongest selling points is its access to nature.
Outdoor Highlights:
Lake Ontario waterfront trails and beaches
Heber Down Conservation Area
Lynde Shores Conservation Area
Durham Forest trail system
Durham’s balance of urban convenience and outdoor living continues to attract professionals, retirees, and families looking for a healthier lifestyle.
Real estate is hyper-local. Pricing, demand, and buyer behaviour can change street by street. As a REALTOR® actively working in Durham Region, I provide:
Neighbourhood-specific market insights
Accurate pricing strategies backed by data
Professional marketing and exposure
Skilled negotiation to protect your interests
Guidance through inspections, financing, and closing
Whether you’re buying your first home, selling a family property, or building an investment portfolio, local expertise translates into real results.
Strong Call to Action: Let’s Talk About Your Goals
If you’re considering buying, selling, or investing in Durham Region, now is the time to get informed and plan strategically.
✅ Request a free home value assessment ✅ Receive custom property alerts ✅ Discuss market timing and strategy ✅ Explore neighbourhoods that fit your lifestyle and budget
Durham Region is not just growing—it’s evolving. With strong infrastructure investment, vibrant communities, and diverse housing options, it remains one of the smartest real estate markets in the GTA.
Staying informed is the first step. Having the right REALTOR® is the second.
Destination Niagara: Unlocking Ontario’s Tourism Titan and the Future of Niagara Real Estate
The Niagara Region—a geographical marvel and a foundational piece of Canada’s history—is currently experiencing a monumental, multi-billion-dollar transformation. Driven by the Ontario government’s ambitious Destination Niagara Strategy, the region is being repositioned as a premier, world-class, four-season global tourism destination. This is not merely a plan for tourism; it is a profound economic and infrastructural overhaul designed to turbocharge growth, double the region’s tourism economic impact to over $6 billion annually, and attract an unprecedented 25 million annual visitors.
This detailed analysis explores the far-reaching scope of the strategy, delves into the mechanics of the five core investment pillars, and critically examines the profound ripple effects these developments are already having on the local communities and, most significantly, the regional property values.
I. The Blueprint for Global Recognition: Five Core Pillars
The Destination Niagara Strategy is built upon five interconnected pillars of investment, each carefully designed to move the region past its reliance on short-term, seasonal tourism and into a year-round economic engine that rivals global entertainment hubs.
1. New Tourism Attractions: Engineering Must-See Destinations
The strategy commits to creating spectacular, world-class attractions that compel visitors to extend their stays from 1-2 days to 3-4 days. This push for longer visitation is crucial for maximizing economic impact.
The Crown Jewel: Toronto Power Generating Station: The cornerstone of the plan is the private-sector-led, $300 million-plus revitalization of the historic Toronto Power Generating Station. This architectural marvel, perched above the Falls, is being converted into a five-star boutique hotel, blending heritage preservation with luxury tourism. The complex will feature a craft brewery, a museum, an art gallery, and a theatre, instantly establishing a new benchmark for high-end hospitality in the region.
Iconic Landmarks and Family Fun: Niagara Parks is actively pursuing procurement for major new infrastructure. This includes a world-class, year-round observation wheel—a true destination landmark—and the redevelopment of the Ontario Power Generating Station into a unique guest experience. Furthermore, the government is seeking information for a brand-new signature theme park attraction and the Niagara River Line attraction, a fully accessible, suspended electric tram system that promises unparalleled views of the Falls as it connects key attractions.
Niagara Parks Momentum: Success stories like the $25 million Niagara Takes Flight flying theatre experience, which welcomed over 120,000 visitors and generated nearly $3.5 million in its initial months, prove the appetite for these high-quality, immersive attractions.
2. Expanding World-Class Gaming: Building an Entertainment Hub
Niagara’s existing casino operations already attract over five million visitors and generate over $500 million in annual revenue. The strategy seeks to significantly enhance this sector. By exploring options to potentially expand the market to multiple new, world-class casinos, the province aims to attract major new private investment in top-tier dining, entertainment venues, and additional luxury hotel capacity. This elevation of the gaming and entertainment offer is crucial to competing with other North American entertainment hubs.
3. Growing Wine and Culinary Tourism: The Agri-Tourism Advantage
The Niagara Region is globally recognized for its VQA wine industry, responsible for 86% of Ontario’s grape production. The plan emphasizes agri-tourism, extending support for grape growers, producers, and winery retail experiences.
This pillar is designed to draw visitors beyond the tourist core into the wider region—including St. Catharines, Niagara-on-the-Lake, and the rural municipalities—to experience the unique terroir through farm-to-table dining, breweries, distilleries, and farmers’ markets. This diversification creates a sustainable, year-round tourism appeal that is less weather-dependent and highly attractive to international markets.
4. Investing in Arts and Culture: Preserving Local Identity
To encourage longer, richer visits, the strategy includes significant investments in cultural institutions. The rebuilding of the Shaw Festival’s historic Royal George Theatre with a $35 million investment, alongside over $1 million in funding for other local festivals and events, ensures the preservation and celebration of the region’s rich heritage. By funding projects that tell the under-told stories of Niagara, including Black and Indigenous history, the government is ensuring the cultural offering is diverse, authentic, and reflective of the region’s past.
None of the above can succeed without improved access. The strategy includes major commitments to infrastructure, leveraging the province’s multi-billion dollar capital plan to improve connectivity within the region and with the Greater Golden Horseshoe (GGH) and international markets.
Highway and Rail: Key projects include expanding the QEW in the Niagara corridor, twinning the Garden City Skyway, and continuing to increase GO Train service. The Niagara Region Transit Master Plan is already outlining stages for network optimization and Sunday service introduction by 2026-2027, with high-frequency networks in urban centres by 2031-2035.
Air Access: Issuing an RFP for development at the Niagara District Airport is a strategic move to unlock its potential to service millions of passengers and generate over $1 billion in economic output, creating a critical air gateway for international visitors.
II. The Property Value Perspective: Highs, Lows, and the Future of Housing
The sheer scale of the Destination Niagara Strategy guarantees a transformative effect on the region’s real estate market. This is a classic example of government and private investment acting as a catalyst for rapid value appreciation.
📈 The Positive Impact: Unprecedented Value Appreciation
The overall outlook for property values in the Niagara Region is decidedly positive, driven by fundamental economic factors:
Premium for Connectivity: The most significant booster outside of the tourist core is the increased GO Train service and highway upgrades. The elimination of the provincial portion of the HST for first-time home buyers on new homes up to $1 million (subject to federal legislation) makes a move to Niagara even more appealing. For many GGH workers, Niagara offers a transit-connected, highly desirable, and relatively affordable alternative to Toronto or Hamilton. This influx of commuter buyers dramatically increases demand for housing near transit hubs in St. Catharines, Grimsby, and Niagara Falls.
Luxury and Economic Diversification: The new five-star hotel, world-class attractions, and expanded dining/gaming venues will generate an array of high-wage, specialized jobs in luxury management, finance, and technology. This influx of “young wealth creators” and highly skilled professionals will boost demand for upscale housing, driving up average sale prices, especially in Niagara Falls and Niagara-on-the-Lake.
Investor Confidence and Rental Returns: The guaranteed increase to 25 million annual visitors creates a gold rush for investors. Properties suitable for short-term vacation rentals (VRUs) will see their income potential soar, making them exceptionally valuable assets. Meanwhile, long-term rentals will see high demand from the growing permanent workforce, ensuring low vacancy rates and strong rental yields. This dual-market pressure pushes up the price ceiling for all homes.
Infrastructure-Led Growth: Areas benefiting from the Niagara Region Transit Master Plan, such as new microtransit hubs and high-frequency routes in Fort Erie, Welland, and Grimsby, will see property values rise as accessibility and quality of life improve.
📉 The Critical Challenge: The Affordability Divide
While asset appreciation is a boon for existing homeowners, the strategy poses serious challenges to social equity and the availability of local labour.
Workforce Displacement: The very success of the $6 billion tourism economy depends on thousands of service industry workers—chefs, hotel staff, attraction operators, and cleaners. These workers typically rely on entry-level and mid-range housing. The dramatic increase in housing costs, driven by high-income commuters and VRU investors, creates a severe affordability crisis. Without proactive measures, essential workers will be priced out of the communities they serve, forcing them into long commutes and straining local infrastructure.
Residential Inventory Strain: The conversion of traditional long-term rentals and residential homes into profitable vacation rental units further depletes housing stock, exacerbating the problem. Municipalities like Niagara Falls are already grappling with how to regulate vacation rental units (VRUs) and single-room occupancy in existing motels to strike a balance. If the supply-demand imbalance is not addressed through targeted housing strategies, including the development of workforce housing and greater residential density, the housing crisis could ironically become the biggest threat to the region’s economic growth targets.
III. A Sustainable Future: Balancing Prosperity and Preservation
The long-term success of Destination Niagara hinges on the province and regional partners managing the trade-offs between economic expansion and community integrity.
Environmental Stewardship: The history of tourism at Niagara Falls, dating back to the 1800s, has always been a battle between preservation and commercialism. Modern influences, including hydroelectric diversion and remedial work, have long been necessary to preserve the Falls. The current strategy commits to balancing growth with preservation, promising to integrate green spaces and eco-friendly initiatives. However, with massive developments like the new theme park and a suspended tram, stringent environmental impact studies and adherence to the Niagara Official Plan are essential to ensure the natural heritage—from the Niagara Glen Nature Reserve to the Escarpment—remains pristine.
Cultural and Social Resilience: The influx of new visitors and the shift towards a high-end, globalized entertainment economy must not come at the expense of local character. Investments in arts and culture are key, but there must be continued commitment to “Creative Niagara”—a recognition that the region’s unique mix of historic towns (Niagara-on-the-Lake), industrial centres (St. Catharines), and rural landscapes must be protected and celebrated. The goal is to ensure that Niagara remains both a great place to visit and a great place to live.
The Destination Niagara Strategy is a powerful, long-term investment in Ontario’s economic future. By leveraging its iconic natural asset and pairing it with smart infrastructure, luxury attractions, and a diversified cultural offering, the province is poised to make Niagara a year-round tourism powerhouse. For homeowners, it means strong appreciation; for prospective buyers and investors, it signals an unmissable long-term opportunity, provided the region successfully navigates the complex challenge of housing affordability.
🏘️ In-Depth Look: Housing Strategies and Zoning Battles in the Niagara Region
Will the region’s prosperity destroy its affordability?
The economic boom and property value appreciation are a double-edged sword, and local municipalities are keenly aware of the brewing crisis.
The research confirms that the Niagara Region and its key cities, such as Niagara Falls and St. Catharines, are actively responding to the housing pressures through comprehensive planning, affordable housing investments, and regulatory changes. Their actions fall into two main categories: increasing the affordable and attainable housing supply and regulating short-term rentals (VRUs) to protect long-term housing stock.
1. Attainable and Affordable Housing Initiatives
The Niagara Region, recognizing that its housing costs are rising faster than incomes (the median rent for a 1-bed unit jumped 19.2% from 2021), has deployed a multi-faceted approach to address the housing spectrum, from homelessness to medium-income household needs.
Niagara Region-Wide Strategies: The Long-Term Roadmap
Consolidated Housing Master Plan (2025 Update): This is the Region’s 25-year roadmap to address the severe need for housing, particularly for low- and moderate-income households. The plan aims to double the current number of community housing units by 2050, committing to building 2,983 new units.
Funding Commitment: The Region is proposing to fund 25% of the expected costs (approximately $546 million) and is actively pursuing co-investment from federal and provincial governments, including leveraging programs like the Canada-Ontario Affordable Housing Fund (AHF) and the Ontario Priorities Housing Initiative (OPHI).
Focus on Existing Assets: A key part of the plan is redeveloping existing Niagara Regional Housing properties to add density on current sites, streamlining delivery, and reducing land acquisition costs.
Attainable Housing Strategy: This strategy specifically targets households with incomes (80-120% of the average) who struggle to afford market-rate housing but do not qualify for rent-geared-to-income (RGI) support. The goals include:
Increasing the supply of rental housing through strategic incentives for purpose-built rentals.
Optimizing the use of existing housing stock and promoting innovative models like modular construction.
Targeted Affordable Housing: Federal and provincial funding, through programs like OPHI, has been funnelled into projects in Niagara Falls and across the Region to create permanent supportive housing and temporary bridge housing for vulnerable populations.
St. Catharines: Intensification and Zoning Reforms
St. Catharines is leveraging its status as a key urban growth area and transit hub to drive density. The city’s current planning reviews and by-law amendments are focused on increasing the housing supply through policy changes:
Zoning By-Law Housekeeping Amendment (April 2024): This significant amendment promotes intensification in established neighbourhoods:
Accessory Dwelling Units (ADUs): It explicitly permits two additional residential units (ADUs) within detached, semi-detached, or townhouse dwellings, including updated standards for detached ADUs (laneway suites).
Missing Middle Housing: It permits duplex, triplex, and fourplex dwellings within the former Low Density – Suburban Neighbourhood (R1) Zone. This move directly responds to the provincial mandate to allow the “missing middle” housing forms and will be crucial for creating more affordable entry points for new buyers and renters.
The Garden City Plan (Official Plan Update): St. Catharines is consolidating its official plan to accommodate a 2051 growth horizon, planning for 18,000 new housing units and 35,000 new residents. The focus is on aligning land use, transportation, and infrastructure to direct growth toward the downtown urban growth area and major transit hubs (like the new GO Station), supporting a compact, efficient built form.
2. The VRU Crackdown: Protecting Residential Housing Stock
The financial incentive to convert residential homes into lucrative short-term rentals (VRUs) is a direct consequence of the Destination Niagara Strategy’s success. Both Niagara Falls and St. Catharines have implemented strict regulatory frameworks to curb this trend and protect long-term housing availability.
Municipality
Regulation Strategy
Key Rules and Fines
Niagara Falls
Restrictive Zoning & High Fines
VRUs (Non-owner-occupied) are only permitted in specific commercial/tourist zones (TC, GC, CB). They are illegal in most residential areas.
Fines: Up to $50,000 for a first offence and up to $100,000 for subsequent offences for operating without a license or in an unpermitted zone.
STRs are generally only permitted when the property remains the host’s primary residence and the operation is an occasional, secondary use (home-based business).
Tax: Collects a 2% Municipal Accommodation Tax (MAT) on short-term stays.
Enforcement: Currently strengthening its by-law enforcement capabilities to regulate public space use and non-compliant operations.
The intent is clear: to legally fence off residential neighbourhoods from the powerful commercial pressures of the $6 billion tourism market. This regulation is crucial for investors—a non-owner-occupied property purchased in a Niagara Falls residential zone cannot be legally operated as a VRU without facing severe fines, forcing these homes back into the long-term rental or owner-occupied housing pool.
The Destination Niagara Strategy is fundamentally an economic growth policy that drives up property values across the board. The local planning and housing initiatives act as a mitigation strategy to manage the social consequences of that growth.
Property Value Prediction: Areas benefiting from the Destination Niagara investments and GO Train connectivity (Niagara Falls tourism zones, St. Catharines downtown) will see the highest appreciation.
Mitigation Success: The success of the zoning changes in St. Catharines (allowing duplexes/fourplexes) and the VRU crackdown in Niagara Falls will be the key to maintaining a functional workforce. If these policies successfully create a greater supply of “missing middle” housing and prevent mass residential displacement, the region can retain the workers necessary to sustain its tourism boom.
The next few years will be a race between the speed of the tourism/economic development and the pace of the housing supply and affordability solutions.
The real estate market inside scoop for the community you love. See homes that are for sale and have recently sold. Find out if home sales in your neighbourhood are trending up or down. See what homes around you are currently selling for.
Bill 60 Deep Dive: The Ultimate Guide for Ontario Landlords, Tenants, Buyers, and Sellers
Bill 60, formally known as the Fighting Delays, Building Faster Act, 2025, has officially shaken up the landscape of rental housing in Ontario. Whether you are a seasoned investor, a first-time renter, or someone looking to buy or sell a tenanted property, these changes are not just “fine print”—they fundamentally alter your rights, timelines, and financial obligations.
This comprehensive guide breaks down every critical aspect of the new legislation, offering detailed analysis, practical scenarios, and checklists to keep you compliant and protected.
What is Bill 60?
At its core, Bill 60 was introduced by the Ontario government with the stated aim of “reducing red tape” and clearing the massive backlog at the Landlord and Tenant Board (LTB). For years, both landlords and tenants have suffered from wait times that can stretch to 8-12 months for a simple hearing.
Getty Images
While the goal of speed is universally appreciated, the methods used in Bill 60 have sparked intense debate. The legislation aggressively shortens timelines for evictions and limits certain tenant defenses, tilting the procedural balance significantly.
The 4 Key Changes You Must Know
1. The “Cash for Keys” Trade-Off (N12 Compensation)
Old Rule: If a landlord wanted to move into their unit (or move a family member in), they had to give 60 days’ notice and pay the tenant 1 month’s rent as compensation.
New Bill 60 Rule: Landlords can now avoid paying the 1-month compensation if they provide a longer notice period of 120 days (4 months) instead of the standard 60 days.
Note: This specifically applies to Section 48 (Landlord’s Own Use).
Strategy: This creates a “Time vs. Money” decision for landlords. If you are cash-poor but have time, you can save money. If you need the unit fast, you pay the compensation for the 60-day exit.
2. “Pay to Say” (Rent Arrears Hearings)
Old Rule: If a landlord filed for eviction due to unpaid rent (L1 application), the tenant could show up at the hearing and raise “new issues” like maintenance problems or harassment to explain why they withheld rent.
New Bill 60 Rule: Tenants can no longer raise these issues at an arrears hearing unless they:
Provide advance written notice.
Pay 50% of the alleged rent arrears into the Board or to the landlord before the hearing can proceed with those arguments.
Impact: This effectively bars tenants who are withholding rent due to severe disrepair (and have spent the money on repairs or other needs) from using that defense without a significant upfront payment.
3. The 7-Day Eviction Clock (N4 Notice)
Old Rule: If a tenant missed rent, the landlord gave an N4 notice. The landlord had to wait 14 days after the notice was served before they could file an application with the LTB.
New Bill 60 Rule: The waiting period has been slashed to 7 days.
Impact: This cuts a week off the eviction timeline. If rent is due on the 1st and unpaid, an N4 can be issued on the 2nd, and the LTB filing can happen as early as the 9th or 10th.
4. Slashed Appeal Windows
Old Rule: Parties had 30 days to appeal an LTB decision to the Divisional Court or request a review.
New Bill 60 Rule: The appeal window is reduced to 15 days.
Impact: You must have your legal counsel and paperwork ready immediately after a decision is rendered.
Pros and Cons Analysis
For Landlords
Pros
Cons
Faster Cash Flow Recovery: The 7-day filing window means you get into the LTB queue faster when rent goes missing.
Strict Procedural Compliance: Shorter timelines mean zeromargin for error. If you mess up a date on a 7-day notice, the LTB will toss your case, and you start over.
Reduced Frivolous Defenses: The “50% payment rule” stops tenants from using maintenance complaints solely as a stall tactic during non-payment hearings.
Marketability Risks: Using the 120-day notice to save money might turn off potential buyers who want vacant possession quickly (more on this below).
Cost Savings: Saving one month’s rent on N12 evictions can amount to $2,000 – $4,000 in savings for patient landlords.
Public Perception: The “Pay to Say” rule is controversial; aggressive use may damage your reputation or lead to tenant activism/rent strikes.
For Tenants
Pros
Cons
Longer Move-Out Time (Option): If a landlord chooses the compensation waiver route, you get 4 months (120 days) to find a new home instead of just 2.
Financial Barrier to Justice: If you withheld rent because your heat was broken, you now need to come up with 50% of that back rent just to have your day in court.
Clearer Timelines: The crackdown on delays might mean that if you file a T6 (Maintenance) application, you actually get heard faster than before.
Speed of Eviction: The 7-day N4 period leaves very little time to seek help from rent banks or social services before legal action starts.
Loss of Compensation: You may lose that critical 1-month rent payment that often served as a moving deposit for your next apartment.
Real-World Scenarios
Scenario A: The “Patient” Landlord
Situation: Sarah owns a condo downtown. Her daughter is graduating university in 5 months and needs the unit.
Action: Sarah serves an N12 notice now, opting for the 120-day termination date.
Result: Sarah does not have to pay her tenant the standard $2,800 compensation. The tenant gets 4 months to find a place, and Sarah saves nearly $3,000.
Scenario B: The “Emergency” Repair Defense
Situation: Mark, a tenant, stops paying rent because his roof is leaking and destroying his furniture. He owes $4,000 in back rent.
Bill 60 Impact: The landlord files for eviction. Mark wants to show photos of the roof at the hearing. The adjudicator asks, “Have you paid $2,000 (50%) of the arrears?” Mark has not.
Result: Mark is blocked from raising the maintenance issue as a defense against the eviction. The eviction for non-payment is likely granted, and Mark must pursue a separate (and later) application for the roof.
Critical Advice for Buyers and Sellers of Tenanted Properties
This is the most complex area of the new bill. The distinction between Landlord’s Own Use (Section 48) and Purchaser’s Own Use (Section 49) is vital.
For Sellers
The “Compensation Trap”: If you are selling a tenanted property, do not assume you can waive the compensation for the buyer. The legislation specifically amends Section 48 (Landlord’s Own Use). It is legally risky to assume this applies to Section 49 (Purchaser’s Own Use).
Recommendation: If your buyer wants vacant possession, stick to the standard 60-day N12 and pay the compensation. Using the 120-day rule to save a few thousand dollars could spook a buyer who doesn’t want to wait 4 months to close.
Marketing: If you have a long closing (e.g., 5-6 months), you might be able to use the 120-day notice before listing or early in the process to clear the unit cost-effectively, but consult a paralegal first.
For Buyers
Closing Dates: If you are buying a tenanted property for your own use, demand a standard 60-day N12. Do not let the seller try to save money with the 120-day notice unless you are perfectly happy waiting 4+ months to move in.
Vacant Possession Clauses: Ensure your Agreement of Purchase and Sale (APS) has a strict clause requiring the Seller to provide vacant possession. With the new appeal window shortened to 15 days, you will know sooner if a tenant is fighting the eviction, allowing you to walk away or renegotiate faster.
Actionable To-Do Lists
For Landlords
[ ] Update Your Forms: Ensure you are using the newest versions of N4 and N12 forms that reflect Bill 60 changes. Old forms may be considered defective.
[ ] Audit Your Arrears: If a tenant is late, issue the N4 on day 2. Mark your calendar for Day 8 to file the L1 application (down from Day 15).
[ ] Budget for Legal: If you plan to use the 120-day notice, verify with a legal professional that your specific scenario qualifies for the compensation waiver.
For Tenants
[ ] Don’t Withhold Rent: Under Bill 60, withholding rent is riskier than ever. Pay your rent, and file a separate T6 (Maintenance) application immediately if repairs are needed.
[ ] Act Fast on N4s: If you receive a 7-day notice, contact a rent bank or legal clinic immediately. You have half the time you used to have.
[ ] Check the Notice: If a landlord gives you 120 days notice and doesn’t pay compensation, make sure they are actually moving in. If they re-rent it or sell it, you can file a T5 (Bad Faith) application for significant damages.
Conclusion
Bill 60 is a double-edged sword. It offers speed and cost-saving potential for landlords but demands rigorous adherence to new, tighter schedules. For tenants, it strips away financial leverage and safety nets, making “paying rent on time” the only safe harbor. Whether you agree with the politics or not, understanding these rules is the only way to survive in Ontario’s new rental reality.
Bill 60 protest video This video provides visual context on the public reaction and protests regarding Bill 60, highlighting the intensity of the debate surrounding these changes.
🚨 Critical Action: Are Your New Notices Legal?
Bill 60 has eliminated your margin for error. The new 7-day N4 timelines and the complex N12 compensation waivers mean a single mistake on paperwork can lead to your LTB application being dismissed—forcing you to start over, or worse, facing substantial bad-faith fines.
Don’t rely on outdated templates or guesswork. Ensure your documentation is 100% compliant with the new Fighting Delays, Building Faster Act before you file.
Protect Your Investment: Book a Bill 60 Compliance Audit
Click below to schedule a rapid, 15-minute audit with a licensed paralegal specializing in Ontario landlord-tenant law.
We will confirm if:
Your 7-day N4 is properly timed and served.
Your 120-day N12 compensation waiver is legally applicable to your scenario (Section 48 vs. Section 49).
Your selling strategy complies with the new purchaser use rules.
Protect your legal right to the unit and save thousands in potential compensation and fines.
The October 2025 Durham Region real estate report reveals a balanced housing market characterized by lower home sales, increased inventory, and easing prices. The average sale price in Durham slipped by about 4-5% year-over-year to roughly $850,000, while homes sold for just under their list price and spent more time on the market. Inventory levels climbed to multi-year highs, giving buyers more options and shifting negotiations in their favor, yet some segments remain competitive—especially lower-priced properties. Sellers are adjusting expectations as market balance improves, and buyers benefit from greater choice and negotiating room, all amid ongoing economic uncertainty, declining mortgage rates, and steady but cautious transactional activity.
Screenshot
Durham Region Real Estate Market October 2025: Key Insights
October 2025 saw shifting dynamics in the Durham Region housing market. Home sales experienced a decline year-over-year, while new listings edged up, signaling a more favorable climate for buyers than in recent years. Lower mortgage rates and downward adjustments in selling prices improved affordability, though broader economic uncertainties are holding some buyers back.
Year-Over-Year Performance
Sales Volume: Home sales were down 9.5% in October 2025 compared to October 2024, echoing a region-wide cooling trend.
Listings: New listings increased by 2.7% year-over-year; active listings supply remains healthy, bolstering buyer options.
Average Price: The region’s average selling price fell by 7.2% compared to October 2024, showing a significant year-over-year price correction.
Benchmarks: In Durham, detached homes averaged $957,800, while townhouses and condos posted average prices of $813,300 and $610,000, respectively.
Market Segmentation: Home Types and Price Ranges
Detached and Semi-Detached Trends
Detached Homes: Average price was $957,800, with 595 transactions. Volumes were down and prices adjusted by about 10% year-over-year, reflecting overall softer market conditions.
Semi-Detached: These properties averaged $848,800 with 104 sales. Year-over-year price drop was about 8%, underscoring increasing price sensitivity among buyers.
Townhouses and Condominiums
Townhouses: The average sale price for townhomes stood at $813,300, slightly higher supply and moderate demand led to more negotiation on sales prices.
Condo Apartments: Durham’s average price for a condo apartment in October 2025 was $610,000, down almost 7% year-over-year. The volume for condo apartment sales was 213, demonstrating stable but selective buyer intent in this segment.
Condo Townhouses: These reached an average price of $704,900, signaling relative stability in entry-level housing.
Sales Volume and Price Range Data
Home Type
Sales Volume
Avg. Price
YoY % Change
Detached
595
$957,800
-10%
Semi-Detached
104
$848,800
-8%
Att/Row Townhouse
86
$813,300
-7%
Condo Apt
213
$610,000
-7%
Condo Townhouse
164
$704,900
-7%
Inventory, Listings, and Buyer/Seller Dynamics
Inventory and Listings
Months of Inventory: Durham Region held around 4–5 months of inventory, up slightly year-over-year. This metric indicates a slowly growing buyer’s market, with more choice and less upward price pressure.
SNLR (Sales-to-New-Listings Ratio): Durham’s ratio hovered in the low 30s, indicative of balanced market conditions. Buyers now have more negotiating power, which translates into lower sale-to-list price ratios.
Buyer and Seller Strategies
Affordability: Lower interest rates and price drops have improved affordability for qualified buyers, especially those with job security and stable financing.
Listing Strategy: Sellers need to price realistically and stage homes attractively, as days-on-market are up, and average property days on market (PDOM) often exceeds 30 days.
Investor Impact: Investors have returned to monitoring the market closely for signs of price bottoms, but most are remaining selective, focused on properties that will cash-flow under higher interest costs.
Durham Region: Community-Specific Highlights
Ajax: 48 detached homes sold at an average of $957,800, while 15 condos averaged $610,000. Average listing days on market ranged from 20 to 30 days.
Oshawa: 144 detached transactions with an average price of $704,900; the town remains a magnet for entry-level buyers due to relatively affordable prices across all property categories.
Pickering and Whitby: Both cities maintained robust new listing activity and had average sale prices in the high $900,000s for detached, with strong diversity in available inventory from condos to large single-family homes.
Economic Factors and Forward-Looking Statements
Interest Rates: The Bank of Canada’s overnight rate in October was 4.7%, with most mortgage products reflecting favorable buyer terms. Weaker monthly sales contributed to weaker price gains, but falling borrowing costs create longer-term optimism.
Unemployment: Toronto’s seasonally adjusted unemployment rate dropped to 2.3%, supporting buyer confidence but not eliminating broader economic anxieties.
Policy Watch: Calls continue for governments to cut buyer costs, end exclusionary zoning, and prioritize new construction, especially as the population grows and housing diversity becomes critical.
What to Expect in Durham Region Real Estate
The Durham Region real estate market in October 2025 provided a classic example of the transition to a buyer-favored environment. While price corrections and increased supply benefitted buyers, overall sales volumes declined as some remained sidelined due to uncertainty. If macroeconomic confidence rebounds, expect pent-up demand to gradually return, particularly if borrowing costs remain low and local job markets stay robust. For now, Durham’s property market offers opportunity for buyers and a clear message to sellers: adapt strategies to this more competitive climate.
The Greater Toronto Real Estate Market Update
The Greater Toronto Area (GTA) real estate market in October 2025 has created a rare and powerful window of opportunity for homebuyers. The latest stats from GTA REALTORS® confirm a clear shift to a buyer’s market, marked by increased inventory, lower prices, and more affordable mortgage payments.
If you’ve been waiting on the sidelines, this is your sign to move forward with confidence.
Metric
October 2024 (Data Source Implied)
October 2025 (Actual Stat)
Change (YoY)
Impact for Buyers
Home Sales
6,783 (Calculated)
6,138
-9.5%
Less Competition
New Listings
15,647 (Calculated)
16,069
+2.7%
More Choice
Avg. Price
$1,135,932 (Calculated)
$1,054,372
-7.2%
Lower Cost
📉 Buyer Advantage: Prices & Payments Are Down
October’s data presents an undeniable financial benefit for buyers with long-term certainty in their employment and income.
Average Selling Price Down: The average selling price in the GTA dropped to $1,054,372, a significant 7.2% decrease compared to October 2024.
Lower Monthly Payments: As TRREB’s Chief Information Officer noted, the monthly mortgage payment for an average-priced home is trending lower. This is due to the combined effect of negotiated price reductions and generally lower borrowing costs, making homeownership more accessible.
Price Benchmark Eased: The MLS® Home Price Index (HPI) Composite benchmark was down by five per cent year-over-year. This indicates a broader, sustained cooling in home values.
Key Takeaway: You can now enter the GTA housing market at a more affordable price point and secure a lower monthly payment than buyers faced just one year ago.
🏡 More Choice: Inventory Is Up
Buyers now have time to breathe, compare, and make a decision without the pressure-cooker bidding wars of the past.
Listings Increase: New listings totaled 16,069 in October, a 2.7% increase year-over-year. While sales were down, the increase in listings means a more diverse selection of properties for you to choose from.
Conditions Favour Buyers: With sales down by 9.5% year-over-year against a rise in new listings, the competition is significantly reduced. This is the definition of market conditions that favour homebuyers, giving you the negotiating leverage you’ve been waiting for.
🚀 Seize the Negotiation Window!
The current market dynamic won’t last forever. As TRREB experts suggest, once economic uncertainty fades and business confidence returns, demand is likely to increase and tighten the market again.
The time to act is now, while inventory is high, prices are favourable, and your negotiation power is at its peak.
Don’t wait for the next wave of buyers to jump in. Secure your future home and lock in your price before the market starts to turn.
🔥 Buyers: Stop Waiting! Schedule Your Exclusive Strategy Call TODAY.
Ready to capitalize on lower prices and higher negotiating power? Let’s discuss a tailored buying strategy to find your dream home at the best possible value.
Are you a homeowner thinking of selling? Even in a buyer’s market, a properly priced and professionally marketed home will still attract the right buyer.
✅ Sellers: Get a Free, Expert Home Valuation.
Don’t let market headlines scare you. Discover what your home is truly worth in today’s competitive environment.
GTA Real Estate Market, October 2025 Stats, Buyer’s Market GTA, Lower Mortgage Payments, Toronto Home Prices Down, GTA Housing Market Forecast, Buy a Home in Toronto, Negotiation Power Real Estate, Affordable GTA Homes
What a whirlwind! If you live in the Greater Toronto Area, this past weekend wasn’t just another spin around the calendar—it was a sensory overload of major events, from time-bending clock changes to nail-biting sports drama and the annual start of a hairy health initiative. It truly felt like everything was happening all at once.
Let’s break down the trifecta that made the last couple of days a massive moment in the city.
⏰ The Great Fall Back: An Extra Hour of Chaos
It began late Saturday night/early Sunday morning with the semi-annual ritual that is Daylight Saving Time (DST) ending. The clocks “fell back” an hour, giving us all the theoretical gift of a glorious extra hour of sleep.
But let’s be honest, it was a little more chaotic than peaceful. Did you set your clock back an hour before bed? Did your phone do it automatically? Did you wake up an hour early, momentarily panic, and then realize you had a bonus hour to… well, probably check Twitter for Blue Jays updates? The GTA’s collective internal clock just got a hard reset, and it’s a groggy adjustment for everyone.
💔 The Heartbreak on the Diamond: Blue Jays’ World Series Thriller
Speaking of Blue Jays updates, the end of DST coincided with one of the most agonizing and electric finishes to a baseball season in recent memory! The last two Blue Jays World Series games were nothing short of a spectacular, emotional rollercoaster.
Game 6 and the decisive Game 7 had us all glued to our screens, shouting at the television, and riding every pitch. The games were a nail-biting, edge-of-your-seat marathon, culminating in a truly heartbreaking loss in extra innings in Game 7. From incredible plays to clutch home runs that had the Rogers Centre crowd absolutely roaring, the team left absolutely everything on the field. It was a tough end, but what an unforgettable run! Thank you, Blue Jays, for a season that kept the entire country on the edge of its collective dugout.
The Show Must Go On: What’s Next for Toronto Sports?
With the baseball season officially over, the Toronto sports focus immediately pivots. This past weekend’s drama was actually preceded and followed by major action on the ice and the court! The Toronto Maple Leafs (NHL) and the Toronto Raptors (NBA) are already well into their seasons, providing the next major events to rally around. After a few rescheduled games to accommodate the Jays, the Leafs and Raptors now take centre stage in their respective title chases. Expect the excitement to shift from the Rogers Centre to the Scotiabank Arena for the foreseeable future!
As the calendar officially flipped, November arrived, and with it, the start of Movember. For those new to the movement, Movember is a global initiative dedicated to raising funds and awareness for men’s health, particularly prostate cancer, testicular cancer, and men’s mental health and suicide prevention.
The visible sign of support? Men growing out their moustaches for the entire month! This weekend was the crucial “Shave Down,” where countless men across the GTA went clean-shaven, ready to start growing their ‘staches for the cause. It’s an excellent conversation starter and a highly visible tribute to the fight against men’s health issues. Keep an eye out for the fledgling Mos around town!
Want to do more than just grow a killer ‘stache? There are many ways to support Movember in the GTA:
Grow a Mo: The classic way! Register on the Movember website, shave down, and get your friends and family to donate to your “Mo Space” fundraising page.
Move for Movember: Not a grower? Commit to running or walking 60km over the month. That’s 60 kilometres for the 60 men we lose to suicide globally, every single hour.
Host a Mo-ment: Organize a fun event, like a trivia night, a bake sale, or a friendly sports tournament (maybe a post-Blue Jays softball game!) and charge an entry fee as a donation.
Mo Your Own Way: Take on any unique challenge! Give up coffee for the month and donate the savings, or try a personal fitness challenge.
The money raised goes to fund groundbreaking men’s health projects, so every action makes a difference!
A Weekend to Remember
So, this past weekend was a lot. We collectively gained an hour, lost a championship, and started an entire month-long facial hair journey, all within a 48-hour window. It was a weekend that proved the city doesn’t slow down, even when the clocks do. Now, as we adjust to the earlier sunsets, mourn the season, and embrace the fuzz, let’s carry that incredible energy into the next phase of the Toronto sports calendar and the vital mission of Movember.
What was the most memorable part of your whirlwind weekend? Let me know in the comments!
As a REALTOR® working in the Toronto area, this week’s interest-rate decision by the Bank of Canada (BoC) is very meaningful for you—whether you are on the buy side or the sell side of a real-estate transaction. Below is a breakdown of the decision, its real-estate implications, and how you and your clients can respond.
1. What did the Bank of Canada decide?
On October 29, 2025 the Bank of Canada cut its target overnight rate by 25 basis points, bringing it to 2.25%.
The Bank Rate now stands at 2.50% and the deposit rate at 2.20%.
The BoC signalled that, if inflation and activity evolve broadly in line with its October projections, “the current policy rate is at about the right level …” and further cuts are not guaranteed.
The underlying economic backdrop: modest growth, trade-headwinds (particularly U.S. tariffs) and inflation near, but slightly above, 2% (with core inflation a little higher) are influencing the decision.
In short: borrowing costs for banks should ease slightly (or at least stabilise) and the BoC is signalling caution about further rate moves—so this is a window of opportunity.
2. Why this is especially relevant for the real-estate market
For Buyers:
Lower policy rates => banks may offer slightly better mortgage terms (or at least less upward pressure) which can boost affordability.
If variable-rate or adjustable mortgage products respond quickly to BoC moves, you may see a dip in payments or an improved debt‐service ratio.
With this rate cut signalling a potential floor, buyers may be more confident stepping into the market now rather than waiting.
Call to action for buyers: If you’ve been on the fence, let’s review your financing options now—this could be a timely moment to lock in favourable terms before any shifting sentiment or rate increases.
For Sellers:
A marginally better affordability environment can broaden the buyer pool—especially first-time buyers or investors who were hassled by elevated rates.
Motivation to list now: If rates remain near current levels and affordability improves, competition can heat up. Listing later could mean facing more competition or less favourable financing for buyers.
Call to action for sellers: Let’s evaluate your home’s market value now, prepare your property for listing, and capitalise on potentially improved buyer demand while this window is open.
3. What’s going on in the Ottawa decision and economy
The BoC emphasised that “ongoing weakness in the economy and inflation expected to remain close to the 2 % target” drove the decision.
On the flip side, the trade‐shock (tariffs) has elevated costs for certain sectors and added uncertainty, meaning the Bank remains cautious.
According to projections, growth remains modest and risks remain elevated — meaning the BoC has to balance supporting the economy and keeping inflation contained.
Mortgage rates don’t immediately mirror the policy rate, but the policy rate serves as a key anchor for banks’ cost of funds and thus influences what lenders offer.
📌 Real-estate note: While a 25 basis-point cut may not immediately translate into a dramatic drop in mortgage rates, the expectation of easier policy and stable rates matters for buyer psychology and listing strategies.
4. How this affects the Toronto / Ontario market specifically
In the greater Toronto region, affordability has been a key issue—higher interest rates squeezed budgets and slowed some sales activity. An easing environment can help.
Sellers who might have been cautious may now find there are more qualified buyers coming off the sidelines.
For investors: lower financing costs can improve cash-flow projections and return calculations, making small-scale investment properties more attractive again.
For first-time buyers: this may be a timely reminder to revisit budgeting and purchase-readiness.
As your REALTOR®, I can help interpret how this interest-rate backdrop translates into your specific neighbourhood, home-type, and budget scenario.
5. Strategic next-steps for you
Buyers:
Get pre-qualified now—we’ll work with your lender to survey the impact of the rate cut on your mortgage options.
Review fixed vs variable rate strategies in light of this decision and your risk-tolerance.
Expand your search with confidence: if the payment burden eases, you might access homes you thought were out of reach.
Let’s craft an offer strategy that capitalises on this moment of improved affordability.
Sellers:
Let’s conduct a market evaluation now: assess your home’s competitive positioning in the upcoming window of opportunity.
Prepare your home—staging, minor repairs, presentation—to ensure you’re ready to list when buyer interest rises.
Timing matters: listing now may catch buyers before they shift focus to other markets or before inventory builds.
Let’s discuss pricing strategy that reflects the slightly improved financing environment for buyers.
6. Visualising the Impact
🍁 What This Fall Market Means for Buyers in the GTA
The Bank of Canada’s latest rate cut to 2.25 % is more than just a headline — it’s a tangible opportunity for GTA buyers. With borrowing costs easing and lenders adjusting their fixed and variable mortgage products, your buying power has effectively increased. Whether you’re a first-time buyer trying to break into the market or a move-up buyer seeking more space, this fall could be the ideal time to act.
The GTA housing market remains diverse — from Toronto’s condo corridors to family homes in Durham, York, and Peel regions — and we’re already seeing signs of renewed buyer interest since the rate announcement. That means inventory may start tightening again as more buyers re-enter the market, especially for well-priced homes in desirable neighbourhoods.
Now is the time to take advantage of improved affordability and a slightly less competitive environment before momentum builds again. Let’s sit down for a confidential buyer consultation to review your goals, pre-approval options, and neighbourhood strategies. As your REALTOR®, I’ll help you secure the right property at the right price — while the market is still in your favour.
📞 Call, text, or email me today to schedule your private consultation and discover what your next move could look like in this evolving market.
🍂 What This Fall Market Means for Sellers in the GTA
For sellers, the fall 2025 market brings renewed optimism — and a valuable window of opportunity. Lower interest rates are stimulating demand and improving buyer confidence, which can translate into more showings, stronger offers, and shorter days on market. Many prospective buyers who had paused earlier this year due to higher borrowing costs are now stepping back in.
This means your property could attract a larger and more motivated pool of buyers, particularly if it’s priced right and presented effectively. From professional staging to tailored marketing plans, positioning your home now — while the market is adjusting to this new rate environment — can help you stand out before winter listings begin to taper off.
Don’t wait until everyone else catches on to the changing momentum. Let’s review your home’s market value, current competition, and strategies to maximise your return this season. Book your confidential seller consultation today, and let’s prepare your property to make the strongest impact in this more favourable market environment.
💼 Reach out directly for a no-obligation, one-on-one conversation — your timing, pricing, and preparation decisions today can make all the difference in your sale results tomorrow.
Navigating This Market with a Professional Advantage
Markets don’t wait — and opportunities like this come in cycles. Whether you’re buying your first home, upgrading, or selling an investment property, strategic timing and expert guidance matter.
As a trusted REALTOR® in the GTA, I provide market insight, negotiation expertise, and data-driven strategies to help you move confidently in today’s evolving landscape.
📲 Let’s talk confidentially about your next move. I offer private consultations for both buyers and sellers to help you make smart, well-timed decisions in this shifting market.
Let’s turn this moment — and this rate cut — into your next real estate success.
7. Final Thoughts & Your Next Move
This week’s rate cut by the Bank of Canada is an important signal to both buyers and sellers: the environment for real-estate transactions is shifting favourably. Buyers have an opportunity to act with somewhat improved affordability, and sellers have a chance to access a broader buyer pool.
👉 If you are considering entering the market — contact me today. I’ll provide a tailored consultation:
For buyers: we’ll map out the best financing strategy and target homes at your new budget.
For sellers: we’ll prepare your home for listing, capitalise on current conditions, and hit the market at an optimal time.
Let’s leverage this interest-rate moment together. Markets move quickly when policy pivots. I’m here to ensure you’re ready.
The real estate market inside scoop for the community you love. See homes that are for sale and have recently sold. Find out if home sales in your neighbourhood are trending up or down. See what homes around you are currently selling for.
On September 17, 2025, the Bank of Canada made its latest policy move:
The overnight rate was cut to 2.50%, down from 2.75%.
This came after several “holds” and in the context of weaker economic data: job losses, rising unemployment, softening demand, cooling inflation.
This change has immediate and potential implications, especially in a market like the GTA, which has been under pressure from affordability issues, declining prices, and high inventories. Let’s dig into what’s happening locally and how both buyers and sellers might respond.
GTA Real Estate Market: Key Metrics & Trends
Here are some of the more recent GTA housing market numbers (August 2025) that matter, especially in light of the rate cut:
Metric
Value / Trend
Implication
Average home sale price (GTA, all types)
~$1,022,143 — down ~4.9% year-over-year.
Prices have softened; potential opportunity for buyers, less upside for sellers unless property is strongly differentiated.
Detached homes
~$1,312,240 — among the biggest drops (~7.2% YoY) in GTA.
Detached remains a premium segment; risk of more correction especially in outer suburbs or less in-demand locations.
Condominums
~$642,195 — down ~4.8% YoY.
Condos remain under pressure, though lower entry cost may draw first-timers or investors.
Townhouses / Semi-Detached
Townhouses: ~$946,395; Semi-detached: ~$980,102; both down YoY.
Mid-priced homes have some correction, but not as steep in all sub-markets.
Sales vs. Listings (Supply)
Active listings high (~27,495 in August), up substantially vs previous years; new listings up; supply has outpaced demand.
Buyers have more options; more negotiating power; sellers will have to compete.
Sales Trend
Sales are increasing year-over-year modestly; buyer activity returning.
Suggests that affordability improvements are starting to matter.
What the Rate Cut Means for GTA Buyers
With the Bank of Canada cutting to 2.50%, here are possible effects on buyers within the GTA, and strategies to take advantage.
Benefit
How to Act
Lower borrowing costs
If you’re using a variable rate mortgage (or renewing soon), you may see immediate relief. Even small monthly savings can free up budget.
Improved affordability
Price drops + lower interest = a more favorable payment schedule. Particularly helpful for first-time buyers or those moving up.
More negotiation power
Greater choice among listings; less competition (fewer bidding wars in many segments); sellers may need to make concessions.
Opportunity to lock in
If fixed mortgage rates begin to follow (depends on bond yields), getting pre-approved and locking in could help avoid future costs.
Risks / cautions for buyers:
Fixed mortgage rates may lag the policy rate change; not all lenders pass cuts immediately, and bond market conditions matter.
Economic uncertainty in the GTA/ON (jobs, trade, immigration) may dampen confidence; some buyers may still hesitate.
Even with lower rates, total cost (down payment, maintenance, taxes, etc.) remains high.
Recommended buyer strategies:
Get pre-approved now. Know exactly what you can afford.
Watch property types: mid-segments (townhouses/semi’s) may see better value than peak detached-home pricing.
Negotiate well: longer days on market, higher inventory = greater leverage. Ask for closing cost help, flexible possession, repairs.
Consider fixed vs variable carefully: variable may benefit sooner, but fixed gives stability if rates reverse.
Think long term: Even if market dips more, buying in GTA tends to build value over years—if you have the ability to hold.
What the Rate Cut Means for GTA Sellers
This rate cut may help stabilize some downward trends, but sellers need to adapt to current realities. Here’s how:
Potential Opportunities
Things You’ll Need to Do Differently
More buyer interest
Buyers discouraged by high rates may return. Homes that are well priced and well presented will see attention.
Faster sales for strong listings
Properties that stand out (location, condition, value) may sell faster, even in a buyer’s market.
Benefit from easing affordability
Lower monthly payments for buyers expand the pool somewhat. Sellers need to recognize where buyers’ budgets are now.
Challenges / risks for sellers:
Prices are down, particularly in detached and condos. Expect lower offers.
Longer time on market; more competition from other sellers.
Buyers will expect more — inspections, incentives, maybe closing terms.
Seller strategies:
Price realistically from the start — avoid overpricing. If you start too high, you’ll lose momentum.
Invest in presentation and staging — a well-maintained, move-in-ready home will stand out among many.
Flexible terms & incentives — consider assisting with closing costs, offering flexible closing dates, or providing minor upgrades/allowances.
Market smartly — highlight affordability relative to past peaks; show what monthly payments could look like post-rate cut.
Watch inventory & timing — there is evidence that inventory, after peaking, is starting to pull back. Becoming one of the early listings in a tightening market helps.
GTA Market Outlook & What Comes Next
Putting it all together:
The rate cut to 2.50% is generally favorable for the GTA, given ongoing price softening and high supply. It helps pull some buyers off the sidelines.
But this is not a magic fix: structural affordability remains a challenge — prices are still high relative to incomes, and many buyers remain cautious.
The balance of power still leans toward buyers in many neighbourhoods, though some sub-areas (especially in high demand) may see more balanced conditions as listings fall.
If economic data worsens (unemployment, trade, inflation), more rate cuts are possible. Conversely, if inflation spikes or supply gets tight, rates could stay stable or even rise again.
Call to Action
If you’re in the GTA and thinking about moving, now’s not the time to stay passive. Whether buying or selling, you need a plan. Here’s what to do:
Buyers: Reach out to mortgage brokers, get price-sensitive search set up, lock in pre-approval. Don’t just browse—calculate what your monthly payments will look like and act when you find value.
Sellers: Talk to one of our team member realtors who know your neighbourhood deeply. Price smart, spruce up your listing, and use the interest cut to show buyers what their payments might be under current conditions.
Want help zeroing in on your neighbourhood? I can pull together a custom GTA-neighbourhood report (price trends, comparable sales, days on market) so you can see whether your area is trending with the broader market, or diverging. Do you want me to put one together for your specific area?
The Greater Toronto Area housing market is showing fascinating dynamics in June 2025. Whether you're a potential buyer looking for the perfect opportunity or a seller considering your next move, understanding these trends is crucial for making informed decisions. Let's dive deep into the numbers that are shaping our market today.
Current Market Condition: BALANCED WITH BUYER OPPORTUNITIES
6,243
Total Home Sales
↓ 2.4% vs June 2024
$1,101,691
Average Selling Price
↓ 5.4% vs June 2024
19,839
New Listings
↑ 7.7% vs June 2024
31%
Sales-to-Listings Ratio
↓ 4% vs June 2024
🏠 SELLERS: Is Your Home Priced Right in Today's Market?
Get a FREE Comparative Market Analysis (CMA) tailored to your property's unique features and location. Know your home's true value in today's shifting market conditions.
Understanding the price variations across different property types is essential for both buyers and sellers. Here's how each category performed in June 2025:
Property Type
Average Price
Units Sold
Market Share
Detached Homes
$1,392,033
3,011
48.2%
Semi-Detached
$1,089,751
601
9.6%
Townhouse
$871,652
1,048
16.8%
Condominium
$696,424
1,510
24.2%
📊 Sales Volume by Property Type
💡 Market Insight
Detached homes continue to dominate the market, representing nearly half of all sales. However, condominiums are showing strong activity, making up over 24% of transactions. This suggests a diverse market with opportunities across all price points.
📈 Market Trends: What the Numbers Really Mean
🏷️ Price Trends
The average selling price of $1,101,691 represents a 5.4% decrease from June 2024's $1,164,491. This price adjustment, combined with lower borrowing costs, is creating new opportunities for buyers who have been waiting on the sidelines.
Key Takeaway for Buyers:
Lower prices + reduced interest rates = improved affordability. This is potentially the best buying opportunity we've seen in recent years.
📋 Supply & Demand
With 19,839 new listings (up 7.7%) and 6,243 sales (down 2.4%), we're seeing increased choice for buyers. The sales-to-listings ratio of 31% indicates a balanced market with slight favor toward buyers.
Key Takeaway for Sellers:
More competition means strategic pricing and presentation are more crucial than ever. Professional guidance is essential now.
📊 Average Selling Prices by Property Type
🎯 BUYERS: Ready to Take Advantage of This Market?
With increased inventory and improved affordability, this could be your moment. Get a FREE consultation to explore your options and develop a winning strategy.
According to TRREB's latest market analysis, several key factors are shaping the current market dynamics:
🏦 Economic Factors
Interest Rate Environment: Lower borrowing costs compared to last year are improving affordability. Additional rate cuts could further strengthen market momentum.
Trade Relations: Economic uncertainty continues to keep some buyers on the sidelines. A firm trade deal with the United States could significantly boost consumer confidence.
🔍 Market Dynamics
Buyer's Market Characteristics: With more listings available, buyers are gaining negotiating power and securing discounts off asking prices.
Seasonal Trends: Month-over-month increases in sales, coupled with declining new listings, suggest a tightening trend through the spring season.
📊 Market Activity Comparison: June 2024 vs June 2025
🏠 What This Means for Sellers
The current market presents both challenges and opportunities for sellers:
📊 The Reality Check
Increased Competition: 7.7% more listings mean more choice for buyers
Price Adjustments: Average prices are down 5.4% year-over-year
Longer Market Times: Properties may take longer to sell than in previous years
🚀 The Opportunities
Motivated Buyers: Those entering the market now are serious about purchasing
Strategic Positioning: Properly priced homes still sell efficiently
Professional Advantage: Expert marketing and pricing strategies are more valuable than ever
📈 SELLERS: Maximize Your Property's Potential
Don't let market conditions discourage you. With the right strategy, pricing, and presentation, your home can stand out from the competition. Get your FREE CMA today!
For prospective buyers, the current market conditions are creating excellent opportunities:
✅ Buyer Advantages
More Choice: 19,839 new listings provide extensive options
Negotiating Power: Buyers are securing discounts off asking prices
Lower Costs: Reduced prices and lower interest rates improve affordability
Less Competition: Fewer competing offers mean better chances of success
⚠️ Considerations
Economic Uncertainty: Stay informed about broader economic trends
Interest Rate Sensitivity: Be prepared for potential rate changes
Property Condition: With more options, you can be selective about quality
📊 Sales-to-Listings Ratio Trend
🔮 Market Outlook: What's Next?
Based on current trends and expert analysis, here's what we anticipate for the remainder of 2025:
📈 Positive Indicators
Gradual Recovery: Month-over-month improvements suggest building momentum
Affordability Gains: Lower prices and borrowing costs are bringing buyers back
Inventory Balance: Healthy supply levels support market stability
🎯 Key Factors to Watch
Interest Rate Decisions: Additional cuts could significantly boost activity
Trade Relations: Economic clarity could improve consumer confidence
Seasonal Patterns: Traditional fall market dynamics may provide opportunities
💼 BUYERS: Don't Wait for Perfect Market Conditions
The best time to buy is when you find the right property at the right price. Let's explore what's available for you in today's market with improved affordability.
In a market with evolving dynamics, having an experienced professional by your side is more important than ever. Here's what sets me apart:
🏆 For Sellers
Precise Market Analysis: Comprehensive CMAs that position your property competitively
Strategic Marketing: Multi-channel approach to maximize exposure
Professional Network: Access to qualified buyers and industry professionals
Negotiation Expertise: Protecting your interests throughout the process
🎯 For Buyers
Market Knowledge: Deep understanding of neighborhood trends and values
Access to Listings: First look at properties matching your criteria
Negotiation Skills: Securing the best possible terms and pricing
Transaction Management: Smooth process from offer to closing
📞 Ready to Make Your Move?
Whether you're buying or selling, the current market presents unique opportunities that require expert navigation. Don't let these conditions pass you by without exploring what's possible.
Data Source: Toronto Regional Real Estate Board (TRREB) Market Report, June 2025 Analysis by: Gerald Lawrence, REALTOR® - Coldwell Banker R.M.R. Real Estate, Brokerage
A Beautiful Start in a Family-Friendly Neighbourhood
Offered at $949,000
Welcome Home A lovingly maintained 2-storey detached link home – perfect for young families and first-time buyers. 📍 Stouffville, ON | 🛏 3 Beds | 🛁 3 Baths | 🚗 1-Car Garage
3 bright and spacious bedrooms, including a sunlit Primary Suite with 4-Piece Ensuite
3 bathrooms total — 2 full 4-piece bathrooms on the upper level, 2-Pc powder room on main floor, and a rough-in in the basement
Open-concept main floor — ideal for family time & entertaining
Eat-in kitchen with walkout to a fully fenced, landscaped backyard
Gas BBQ hookup, perennial flower beds, garden shed, and low-maintenance front garden
Built-in 1-car garage with backyard man-door
Finished basement featuring:
Recreation room
Bonus/office room
Utility & laundry room
Cold room and storage room with built-ins
2–5 mins from top-rated Barbara Reid PS, Sunnyridge Park, tennis & basketball courts
📍 Quiet street in a close-knit, family-oriented community!
📸 3D Interactive Virtual Tour
👨💼 About Gerald Lawrence
Hi, I’m Gerald — a full-time, full-service REALTOR® with Coldwell Banker R.M.R. Real Estate. I help first-time buyers and young families find homes where they can truly thrive. My knowledge of the Stouffville market and personalized approach ensure that you’ll feel confident and cared for every step of the way.
Is this home move-in ready? Yes — it’s been lovingly maintained by the original owner since 2010 and is in excellent condition.
What type of home is it? It’s a 2-storey detached link home — fully detached above ground with a shared foundation wall below grade.
Can the basement be expanded? Absolutely. The basement already mostly finished and has a rough-in for a full bathroom, allowing you to finish it to suit your needs.
Is the area good for families? Definitely! It’s located within walking distance of Barbara Reid Public School, local parks, sports courts, and family amenities.
How do I book a tour? 📲 Contact me directly at 416-556-0238 or 📧 Email Click To Send Email
✉️ Interested in 14 Betula Gate? Let’s Talk!
Ready to book a showing or have a few questions? I’d love to help.
👉 Submit your inquiry below or email me directly. 📩 Click To Send Email 📞 416-556-0238
On June 4, 2025, the Bank of Canada (BoC) announced it would maintain its benchmark interest rate at 2.75%. This cautious move reflects concerns over inflation, trade uncertainty, and a moderating labour market. This is a significant moment, marking a continued pause in rate adjustments after previous cuts.
🚦 BoC Hits the “Hold” Button: What Does It Mean For YOU? 🚦
The Bank of Canada’s job is like being the country’s economic pilot: they try to steer us toward stable prices (keeping inflation in check!) and healthy growth. Today’s decision to keep interest rates unchanged at 2.75% tells us a lot about what they’re seeing on their economic dashboard.
🔍 The Big Picture: Why the Hold?
The Bank’s Governing Council decided to keep rates steady because they’re navigating a complex economic landscape. Here’s what they’re seeing:
Global Uncertainty is STILL High: 🌍 Especially concerning is the ongoing back-and-forth with U.S. tariffs and trade negotiations. This creates a big question mark for Canada’s export-driven economy. The Bank needs more clarity on how these trade policies will shake out.
Canadian Economy: Softer, But Not Collapsing! 💪 Canada’s economy grew a bit stronger than expected in the first quarter (2.2% GDP growth!), driven partly by exports to the U.S. and inventory building. However, they expect the second quarter to be weaker as these factors reverse. Consumer spending has slowed, and housing activity is down, particularly resales.
Inflation’s Tricky Dance: 📈 While inflation has generally eased from its peak, the Bank noted “unexpected firmness” in recent inflation data, and their preferred core inflation measures have moved up. Businesses are still expecting tariffs to raise prices, and many plan to pass those costs on. This “stickiness” in inflation is a key reason for the hold.
Labor Market Cooling: 🌬️ The job market has shown signs of weakening, especially in sectors tied to trade. The unemployment rate has risen to 6.9%. This typically puts downward pressure on inflation, but the Bank is watching carefully.
In simple terms: The Bank is seeing conflicting signals! The economy isn’t collapsing, but there’s a lot of uncertainty from tariffs and inflation isn’t quite behaving as smoothly as they’d like. So, they’re taking a cautious “wait and see” approach.
📌 Key Highlights
Inflation: Headline inflation fell to 1.7% in April, while core inflation remains sticky.
GDP Growth: The economy expanded by 2.2% in Q1 2025.
Labour Market: Signs of softening with slower wage growth and rising unemployment.
External Pressure: Tariff increases from the U.S. add uncertainty to exports.
Buyers: A continued hold on rates might support affordability — but be mindful of inflation.
Businesses: Exporters should prepare for volatility, especially due to U.S. trade policies.
🏡 What Does This “Hold” Mean for Your Money?
This decision has direct impacts on everyday Canadians. Let’s break it down:
For Borrowers (Especially Variable-Rate Mortgages & HELOCs): 🥳 GOOD NEWS! Your payments linked to the prime rate will stay STABLE for now. No immediate jumps in your monthly costs! This offers a much-needed breathing room. If you’re looking for a new variable mortgage, rates won’t have shifted due to this announcement.
For Savers (HISAs & GICs): 💸 STILL DECENT RETURNS! While not increasing, the rates on high-interest savings accounts and GICs will remain relatively attractive. This is a positive for those looking to grow their cash safely.
For the Housing Market: 🏠 The unchanged rate could bring a degree of stability, preventing further upward pressure on mortgage costs. However, affordability remains a significant hurdle for many, and the Bank noted a “sharp contraction in resales.”
For Businesses: 💼 Borrowing costs remain unchanged, which offers predictability for investment and operational decisions. However, uncertainty from U.S. tariffs and slower domestic demand are still headwinds.
🔮 Looking Ahead: The Bank’s Crystal Ball (Sort Of!)
The Bank of Canada made it clear they are “proceeding carefully” and will be “data-dependent.” This means they’re not committing to any future moves right now. They want to see:
How U.S. trade policy evolves and its real impact on Canadian exports.
How much any economic slowdown spills over into business investment, employment, and household spending.
How quickly cost increases (like from tariffs) are passed on to consumer prices.
How inflation expectations evolve among consumers and businesses.
Key takeaway from Governor Tiff Macklem: While there might be room for future rate cuts if the economy weakens further and price pressures stay contained, the Bank is not providing forward guidance. They are focusing on the actual data as it comes in.
✨ Your Turn!
What are your thoughts on this latest decision from the Bank of Canada? Are you breathing a sigh of relief, or hoping for more changes soon? Share your perspective in the comments below! 👇
The BoC will review its stance again on July 30, 2025. With inflation easing yet core pressures lingering, a potential rate cut remains on the table — but not guaranteed.
Canadian Housing Market Pauses in April 2025 Amid Shifting Conditions
The Canadian housing market showed signs of a pause in its recent slump during April 2025, with national home sales remaining virtually unchanged from March. However, activity remains subdued compared to the previous year, and prices continue to see modest declines. This analysis, based on data released by the Canadian Real Estate Association (CREA), delves into the key trends observed in April. Key Highlights for April 2025:
National Home Sales:
Month-over-month: -0.1% (seasonally adjusted)
Year-over-year: -9.8% (actual, not seasonally adjusted), with 44,300 units sold compared to 49,135 in April 2024.
Prices:
MLS® Home Price Index (HPI):
Month-over-month: -1.2%
Year-over-year: -3.6%
National Average Sale Price: $679,866
Year-over-year: -3.9% (actual, not seasonally adjusted)
Listings and Inventory:
New Listings (month-over-month): -1.0%
Total Active Listings: 183,000 (up +14.3% year-over-year, but still below the long-term average of approximately 201,000 for this time of year).
Market Balance:
Sales-to-New Listings Ratio (SNLR): 46.8% (up slightly from 46.4% in March). This indicates a market approaching balanced conditions, though still at the lower end of the 45%-65% range typically associated with balance. The long-term average for the SNLR is 54.9%.
Months of Inventory: 5.1 months, which is in line with the long-term average of five months. A seller’s market is typically below 3.6 months, and a buyer’s market above 6.4 months.
Detailed Analysis:
The April 2025 data suggests a stabilization in sales activity after several months of decline. Shaun Cathcart, CREA’s Senior Economist, noted that the market is returning to the “quiet markets we’ve experienced since 2022,” with factors like “tariff uncertainty taking the place of high interest rates in keeping buyers on the sidelines.”
While sales activity paused its descent on a month-over-month basis, the year-over-year comparison still shows a significant drop, indicating that the market is considerably cooler than in April 2024. Price pressures continue, with both the MLS® HPI and the national average sale price registering year-over-year declines.
The month-over-month decrease in the HPI suggests that price adjustments are ongoing. The number of newly listed propertiesdipped slightly in April compared to March. However, the total number of homes available for sale has increased notably from a year ago, offering more choice to potential buyers.
Despite this increase, total inventory remains below long-term averages. The sales-to-new listings ratio moving slightly up to 46.8% and 5.1 months of inventory suggest the national market is largely balanced, albeit with regional variations. Regional Variations: The national figures mask significant regional differences. CREA reports indicate:
Ontario and British Columbia: These more expensive markets are generally experiencing larger price pullbacks and higher inventory levels, with sales potentially decreasing more significantly.
Maritimes, Quebec, Manitoba, and Saskatchewan (Prairies, East Coast): These traditionally more affordable regions are seeing some price resilience or even increases, along with tighter inventory conditions.
Valérie Paquin, CREA Chair, emphasized this divergence: “The number of homes for sale across Canada has almost returned to normal, but that is the result of higher inventories in B.C. and Ontario, and tight inventories everywhere else.” Visual Summary: The following charts illustrate some of the key trends: Total Active Listings vs. Long-Term Average (April 2025) This chart compares the total number of homes available for sale at the end of April 2025 against the typical long-term average for that time of year. It also notes the year-over-year change in active listings. This chart compares the total number of homes available for sale at the end of April 2025 (183,000, up 14.3% year-over-year) against the typical long-term average for that time of year (approximately 201,000). It shows that while listings have increased from last year, they still haven’t reached the historical average for April. Sales-to-New Listings Ratio (SNLR) – April 2025 This chart shows the SNLR for April 2025, comparing it to the long-term average and the thresholds for different market conditions (buyer’s, balanced, seller’s).
This chart shows the Sales-to-New Listings Ratio (SNLR) for April 2025 at 46.8%. It compares this to the long-term average SNLR of 54.9% and highlights the range typically considered a “balanced market” (45% to 65%). The current SNLR sits at the lower end of this balanced range, indicating that while the market isn’t strongly favouring buyers or sellers, it’s leaning slightly towards conditions that could offer buyers more leverage than if the ratio were higher.
Analysis:
April 2025 data points to a stabilization in sales activity following several months of declining figures. According to CREA’s Senior Economist, Shaun Cathcart, “the 2025 Canadian housing story would best be described as a return to the quiet markets we’ve experienced since 2022, with tariff uncertainty taking the place of high interest rates in keeping buyers on the sidelines.”
This suggests that while the sharp decline in sales may have paused, underlying caution persists among market participants. The year-over-year decrease in home sales by nearly 10% underscores that the market remains significantly cooler than in the spring of 2024. This slowdown in activity is accompanied by ongoing price adjustments.
Both the MLS® HPI and the national average sale price saw year-over-year decreases, with the HPI also declining month-over-month, indicating continued downward pressure on home values. On the supply side, new listings saw a slight dip from March to April. However, the total number of homes available for sale has risen substantially compared to the previous year, giving prospective buyers more options.
Despite this increase, overall inventory levels have not yet reached their long-term averages for this time of year. The national market, as indicated by the SNLR and months of inventory, appears to be in a state of balance. However, this national picture is an aggregation of varied local conditions. Regional Variations: The Canadian housing market is not monolithic, and significant regional differences persist:
Ontario and British Columbia: These provinces, particularly their more expensive urban centers, are generally experiencing more pronounced price pullbacks. Inventory levels are higher, and sales activity has seen more significant declines compared to other parts of the country.
Prairie Provinces (Alberta, Saskatchewan, Manitoba) and Atlantic Canada (Maritimes, Newfoundland and Labrador), and Quebec: In contrast, many markets in these regions are demonstrating more resilience. Some are even witnessing modest price growth and continue to experience tighter inventory conditions relative to demand.
CREA Chair Valérie Paquin highlighted this disparity, stating, “The number of homes for sale across Canada has almost returned to normal, but that is the result of higher inventories in B.C. and Ontario, and tight inventories everywhere else.” This underscores the importance of understanding local market dynamics when considering buying or selling property. Visual Summary of Key Market Indicators: The following charts provide a visual representation of some of the key changes in the Canadian housing market for April 2025: Canadian Housing Market – Year-over-Year Changes (April 2025 vs April 2024) This chart illustrates the percentage change in actual home sales, the MLS® Home Price Index, and the national average sale price compared to April of the previous year. All key metrics show a decline, highlighting the cooling trend. Canadian Housing Market – Month-over-Month Changes (April 2025 vs March 2025)
This chart displays the percentage change in seasonally adjusted national home sales, new listings, and the MLS® Home Price Index compared to the preceding month. It shows a near flatline in sales, a slight decrease in new listings, and a continued modest decline in the HPI. In conclusion, the Canadian housing market in April 2025 was characterized by a pause in the recent sales slump, ongoing price moderation, and a nationally balanced market that masks significant regional variations. Factors such as economic uncertainty, including trade tariff concerns, continue to influence buyer and seller behavior.
The decision to sell your home is significant, and the current market presents a nuanced landscape. While national prices have seen some moderation and sales activity, though stabilizing month-over-month, remains below last year’s levels, there are compelling reasons to consider listing, especially if your circumstances align. Why This Might Be a Good Time for You to Sell:
Stabilizing Market Activity: After a period of decline, national sales activity showed signs of pausing its slump in April. This could indicate that buyers who were on the sidelines are beginning to re-engage, potentially creating a window of opportunity before any further significant market shifts.
Inventory Levels Offer a Mixed Picture: While total active listings are up year-over-year (meaning more competition than last year), they still remain below the long-term average for this time of year in many areas. A well-priced and well-presented home can still capture significant attention.
Regional Strengths Persist: If your property is located in markets like the Prairies, Quebec, or parts of Atlantic Canada, you might find conditions are still relatively strong with resilient pricing and tighter inventories. Even in markets like Ontario and BC that have seen more significant price adjustments, unique properties in desirable locations can still attract motivated buyers.
Capture Current Price Levels: While prices have dipped from their peak, they are still substantial in many regions compared to historical levels. If you’re concerned about further price erosion, selling now could allow you to lock in your property’s current value. Waiting doesn’t guarantee a better outcome, especially if national price trends continue their modest decline.
Motivated Buyers Are Still Active: Serious buyers are always in the market. Those active now are likely navigating current conditions with clear intentions, potentially leading to smoother transactions if you connect with the right one.
To maximize your success, it’s crucial to:
Price Strategically: Overpricing in this market can lead to your home sitting longer. Work closely with a local real estate professional to set a competitive and realistic price based on the very latest comparable sales.
Ensure Your Home Shines: With more choice for buyers than last year, presentation matters more than ever. Invest in staging, decluttering, and addressing any necessary repairs.
Be Flexible: Understand that negotiation might be more common. Being open to reasonable offers and conditions can facilitate a successful sale.
If your personal and financial goals align with a move, listing now allows you to capitalize on the current buyer interest and potentially transition to your next property with more clarity than in a more volatile market.
For prospective homebuyers, the April 2025 market data reveals an environment that offers several advantages compared to the frenetic conditions of the recent past. If you’re financially prepared, this could be an opportune time to make your move. Why This Might Be a Good Time for You to Buy:
Increased Choice and Less Frenzy: The 14.3% year-over-year increase in total active listings means you have more properties to choose from. With national sales down 9.8% compared to last April, there’s generally less competition for each home, reducing the likelihood of intense bidding wars.
Price Moderation Offers Better Value: Both the MLS® Home Price Index and the national average sale price have declined year-over-year (by -3.6% and -3.9% respectively). This softening of prices can make homeownership more accessible and potentially offer better long-term value.
More Balanced Market Conditions: Key indicators like the Sales-to-New Listings Ratio (46.8%) and Months of Inventory (5.1 months) point towards a more balanced national market. This environment typically affords buyers more time for due diligence, less pressure to make rushed decisions, and potentially more room for negotiation on price and conditions.
Favourable Conditions in Certain Regions: If you are looking in markets like Ontario or British Columbia, you may find more significant price pullbacks and a greater willingness from sellers to negotiate, creating specific buying opportunities.
Opportunity for Long-Term Investment: Housing is a long-term investment. Entering the market during a period of price stabilization or modest decline can be advantageous for buyers with a long-term horizon, as you’re potentially buying at a more sustainable price point.
Stable Interest Rate Environment (Relatively Speaking): While interest rates remain a key consideration, the acute uncertainty around rapid rate hikes has somewhat subsided. This allows for more predictable mortgage planning. Shaun Cathcart of CREA noted “tariff uncertainty taking the place of high interest rates in keeping buyers on the sidelines,” suggesting some buyers might be adapting to the current rate environment.
To make the most of the current market, consider the following:
Get Pre-Approved for a Mortgage: Know your budget definitively. This will strengthen your negotiating position.
Work with an Experienced Buyer’s Agent: They can help you identify suitable properties, understand local micro-market conditions, and guide you through the negotiation process.
Don’t Try to Perfectly Time the Bottom: It’s nearly impossible to buy at the absolute lowest point. Focus on finding a home that meets your needs and budget in a market that is offering more favorable conditions than seen in quite some time.
If you have a stable financial situation and a long-term perspective, the current market conditions provide a window of opportunity to purchase a home with more choice, less pressure, and potentially better value.
The Greater Toronto Area (GTA) real estate market continued to evolve in April 2025, reflecting broader economic pressures, buyer psychology, and seasonal trends. Whether you’re a homeowner, investor, or first-time buyer, understanding current housing data is critical.
In this article, we break down the latest TRREB Market Watch statistics, offer insight into price fluctuations, sales activity, and what this all means for your next move in the real estate market.
Here’s a detailed look at real estate sales and prices by home type across the 416 (Toronto) and 905 (suburban) areas.
📊 Sales & Average Price by Property Type
Type
Sales
(416)
Sales
(905)
Total
Sales
Avg Price
(416)
Avg Price
(905)
Detached
1,430..
2,556..
3,986..
$1,431,495..
$1,324,280..
Semi-Detached.
505
778
1,283
$1,088,848
$944,934
Townhouse
312
925
1,237
$912,629
$884,746
Condo Apt
983
728
1,711
$678,048
$618,196
💬 Year-over-Year Price Change by Property Type
Detached: -6.9%
Semi-Detached: -5.0%
Townhouse: -5.2%
Condo Apartment: -6.1%
📉 Across all segments, buyers gained greater leverage due to elevated real estate inventory levels and improved affordability through moderated mortgage rates.
📉 What’s Behind the Dip in Sales?
Despite following a typical seasonal uptick from March, April 2025 real estate sales fell 23.3% year-over-year. This hesitation is largely attributed to:
Economic uncertainty: Following the federal election, many are monitoring the Canada-U.S. trade relationship, which may impact consumer confidence.
Improved inventory: Buyers now have more choices, leading to longer decision-making timelines.
📊 Economic Indicators Snapshot
Indicator
Value
Trend
Inflation (CPI YoY)
2.8%(Apr 2025)
↑ from 2.3% Mar
Toronto Unemployment Rate
5.0%(Apr 2025)
↑ from 4.8% Mar
Bank of Canada Overnight Rate
2.750%
↔ steady
Prime Lending Rate
6.45%
↔ steady
5-Year Fixed Mortgage Rate
5.09% avg.
↓ slightly
🌍 Regional Trends: Urban vs. Suburban
The 905 regions (e.g., Durham, York, Peel) showed resilience in price stability while urban centers like Toronto (416) saw sharper price drops, especially in condo segments.
🏙 Toronto (416):
Condos down 6.1%
Detached prices remain highest at $1.43M
🏘 Suburbs (905):
Balanced activity
Greater affordability attracted more buyers despite market cooling
There’s growing demand for properties with some backyard space and/or additional buildings, especially among buyers moving from subdivision homes in City Centers. If you’re thinking of selling and your property fits this profile, now may be the perfect time to connect with qualified buyers.
📈 Chart: TRREB Sales Activity YoY
Real Estate Sales are down, but opportunities are up for savvy buyers and well-prepared sellers.
🤝 Let’s Talk: Free Market Evaluation
If you’re wondering about your home’s value in today’s changing market, I offer a FREE, no-obligation market evaluation that can help you decide if now is the right time to sell.
Whether you’re staying local or heading outside of the city to York Region or Durham Region and the Kawarthas, I can guide your move with real insights and connections to active, qualified buyers.
Summary
In April 2025, the Greater Toronto Area (GTA) real estatemarket saw a continued seasonal rise in activity from March, but overall real estate sales remained significantly lower than the same period in 2024. TRREB reported a 23.3% year-over-year drop in home sales, with only 5,601 transactions completed.
At the same time, new real estate listings rose by 8.1%, providing buyers with greater inventory and more negotiating power. The average home price fell by 4.1% to $1,107,463, while the MLS® Home Price Index Composite dropped 5.4% year-over-year, reflecting buyers’ cautious stance amid high borrowing costs and economic uncertainty following the recent federal election.
Elevated inventory and moderating mortgage rates contributed to more affordable housing options across the GTA. Detached, semi-detached, and condo apartment segments all experienced price declines, with detached homes in the 416 region averaging over $1.43 million.
Meanwhile, broader economic indicators showed continued inflation and employment growth, although real GDP growth remained uneven across timeframes. As households monitor developments in Canada’s trade relations and monetary policy, the GTA market is positioned for possible shifts in buyer sentiment should confidence improve and borrowing conditions ease.
Sales are lower largely due to buyer hesitation around high interest rates and economic uncertainty following the recent federal election and the ongoing trade war.
2. Is this a good time to buy real estate in the GTA?
Yes, if you’re financially ready. There’s less competition and more choice, giving buyers leverage in negotiations.
3. How can I make my home more attractive to buyers?
Highlight key features such as land, workshops, finished basements, or upgrades. Price competitively and stage professionally.
4. What’s the best area within an hour or two of Toronto to find land with buildings?
Areas north and east of York Region and Durham Region —such as Uxbridge, Clarington, Georgina, Brock, and parts of Kawartha Lakes—are growing in popularity among buyers looking for space and utility.
It gives you an accurate sense of your home’s current market value, helping you plan with confidence. No strings attached.
📝 Final Thoughts
The GTA housing market is shifting, but with the right guidance, you can take full advantage of today’s conditions—whether you’re buying your dream rural property or selling your urban home.
📩 Let’s connect to discuss your goals and how I can help you navigate the market confidently.
Thinking about selling your rental or secondary property? Before you do, it’s critical to understand how capital gains tax can affect your bottom line. This guide explains what you need to know, what’s changed, and how to plan ahead.
Capital Gains in Canada: What Real Estate Investors Need to Know
Thinking about selling your rental or secondary property? Before you do, it’s critical to understand how capital gains tax can affect your bottom line. This guide explains what you need to know, what’s changed, and how to plan ahead.
Capital gains taxation is an important consideration for property owners and investors across Canada, particularly those holding secondary residences and rental properties.
Understanding how capital gains work, the implications for your tax obligations, and how strategic planning can mitigate liabilities is essential for making informed financial decisions.
What Are Capital Gains?
Capital gains occur when an asset, such as real estate, is sold for more than its adjusted cost base (ACB), which includes the purchase price plus certain costs like legal fees, renovations, and selling expenses.
In Canada, 50% of a capital gain is taxable and added to the seller’s income for the year. This is known as the capital gains inclusion rate.
For instance, if a property is sold for $1 million and the ACB is $600,000, the gain is $400,000, of which $200,000 would be taxable.
The Impact on Real Estate, Including Rental Properties
The principal residence exemption allows homeowners to shelter the full capital gain from tax if certain criteria are met.
However, secondary residences and rental properties do not qualify for this exemption.
When selling a rental property, the taxable portion of the gain is added to your total income, potentially pushing you into a higher tax bracket.
Additionally, if Capital Cost Allowance (CCA) was claimed on the property to offset rental income, a portion of that may be recaptured and taxed as income, not a capital gain.
This creates a tradeoff between the benefit of reducing taxes annually versus facing higher taxes upon sale.
Balancing Timing and Tax Efficiency
One of the key challenges for property owners is timing the sale of a secondary property. Selling in a year when your other income is lower can reduce the overall tax impact.
Conversely, selling during a high-income year could significantly increase your marginal tax rate, resulting in a larger tax bill.
Tax planning strategies can help balance this tradeoff:
Deferring the sale to a year with lower income
Using capital losses to offset gains
Transferring ownership to a spouse in a lower tax bracket (with caution, due to attribution rules)
These strategies highlight the importance of personalized tax planning, particularly when dealing with sizable capital assets like real estate.
Looking Ahead: Potential Tax Changes
In the 2024 federal budget, the government announced its intention to increase the capital gains inclusion rate from 50% to 66.67% for gains over $250,000, effective January 1, 2026.
This would have had significant implications for investors holding high-value assets, especially real estate.
The proposed change introduced further complexity, requiring even more careful consideration of timing and asset disposition.
This decision has been welcomed by many in the investment and real estate sectors, as it preserves the current planning frameworks and alleviates concerns of increased tax burdens on large asset sales.
Real-World Example
Consider a scenario where an Ontario investor sells a secondary rental property for $1 million in 2025.
The original purchase price was $500,000, with $50,000 in eligible improvements and $40,000 in selling expenses, bringing the adjusted cost base to $590,000.
The capital gain is $410,000, and 50%—or $205,000—is taxable. Assuming the seller falls into the 33% marginal tax bracket, the tax owing on the gain could be approximately $67,650.
Had the proposed inclusion rate increase to 66.67% been implemented in 2026, the taxable portion would have been $273,347, with an estimated tax burden closer to $90,000—illustrating the significant impact such a policy change could have had.
Making Informed Decisions
The decision to sell a secondary residence or rental property in Canada carries notable tax consequences. Capital gains tax, while only applied to 50% of the gain (for now), can substantially affect your net proceeds. Properly accounting for selling expenses, potential CCA recapture, and the timing of the sale are all vital to reducing your tax liability.
For real estate investors, the key lies in understanding how the rules apply, what tradeoffs exist, and how to plan effectively. Working with a financial advisor or tax professional can help navigate these complexities, ensuring that your investment decisions align with both your financial goals and the tax landscape.
Need personalized guidance?Contact Gerald Lawrenceto book a private consultation and learn how to maximize your returns when selling investment properties.

 Facebook
 X
X
 Pinterest
 Copy Link


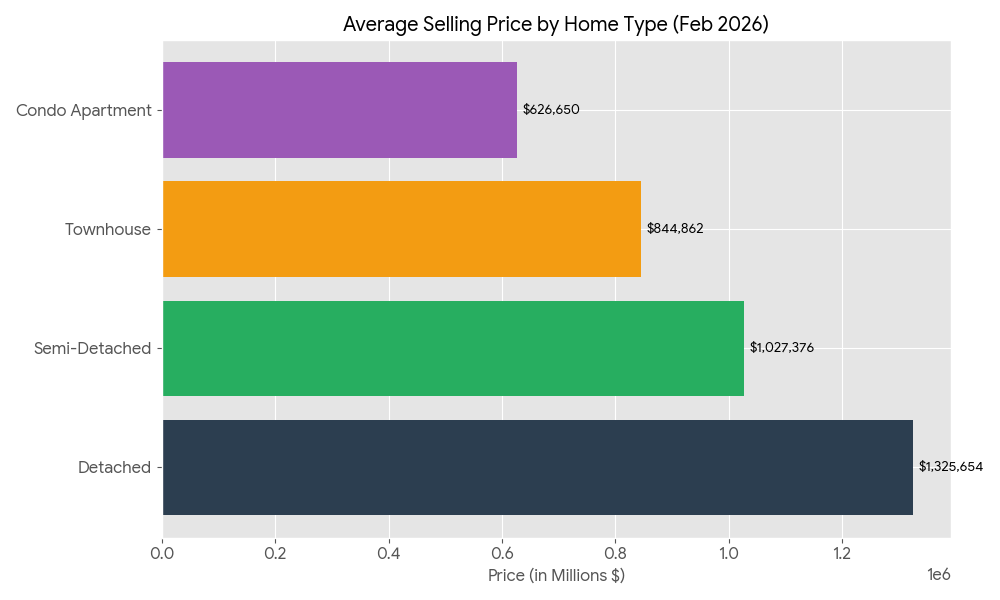
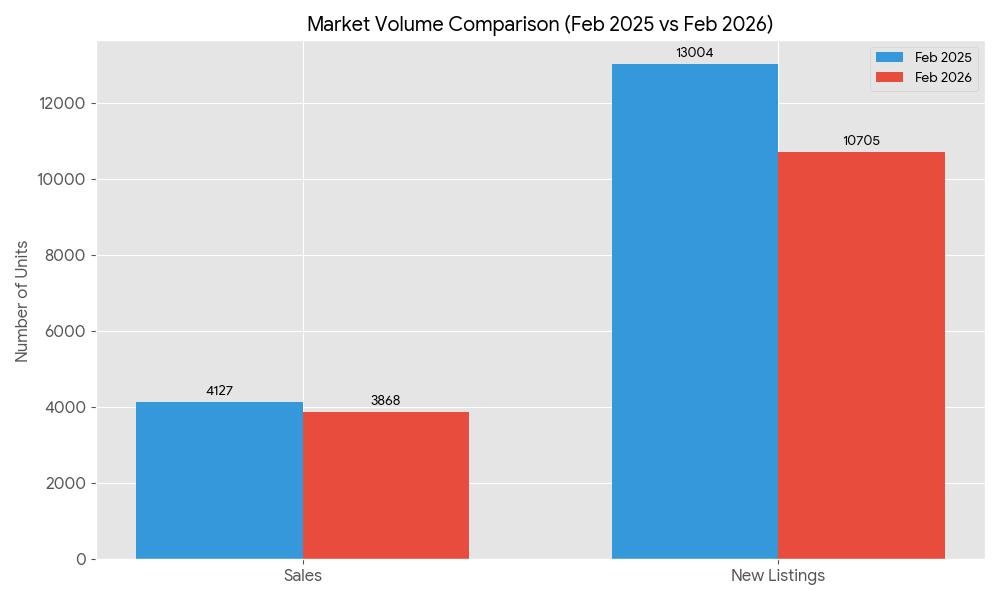
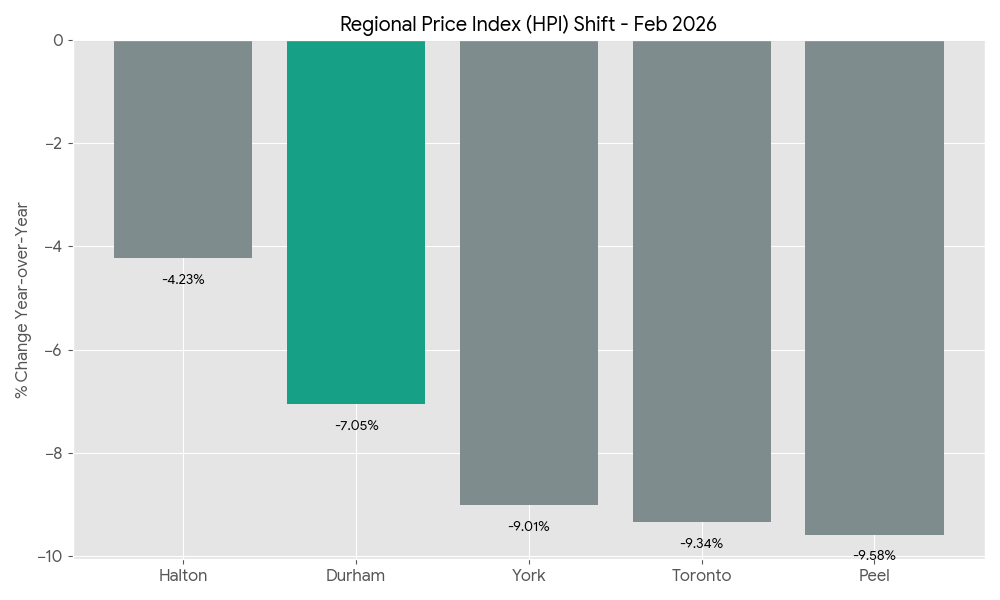
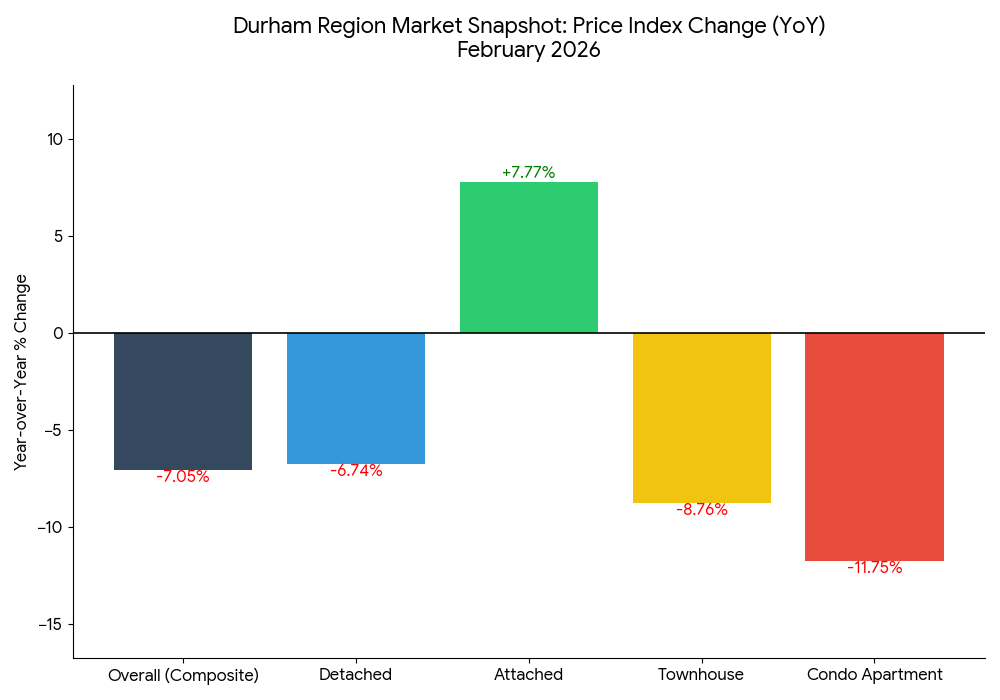
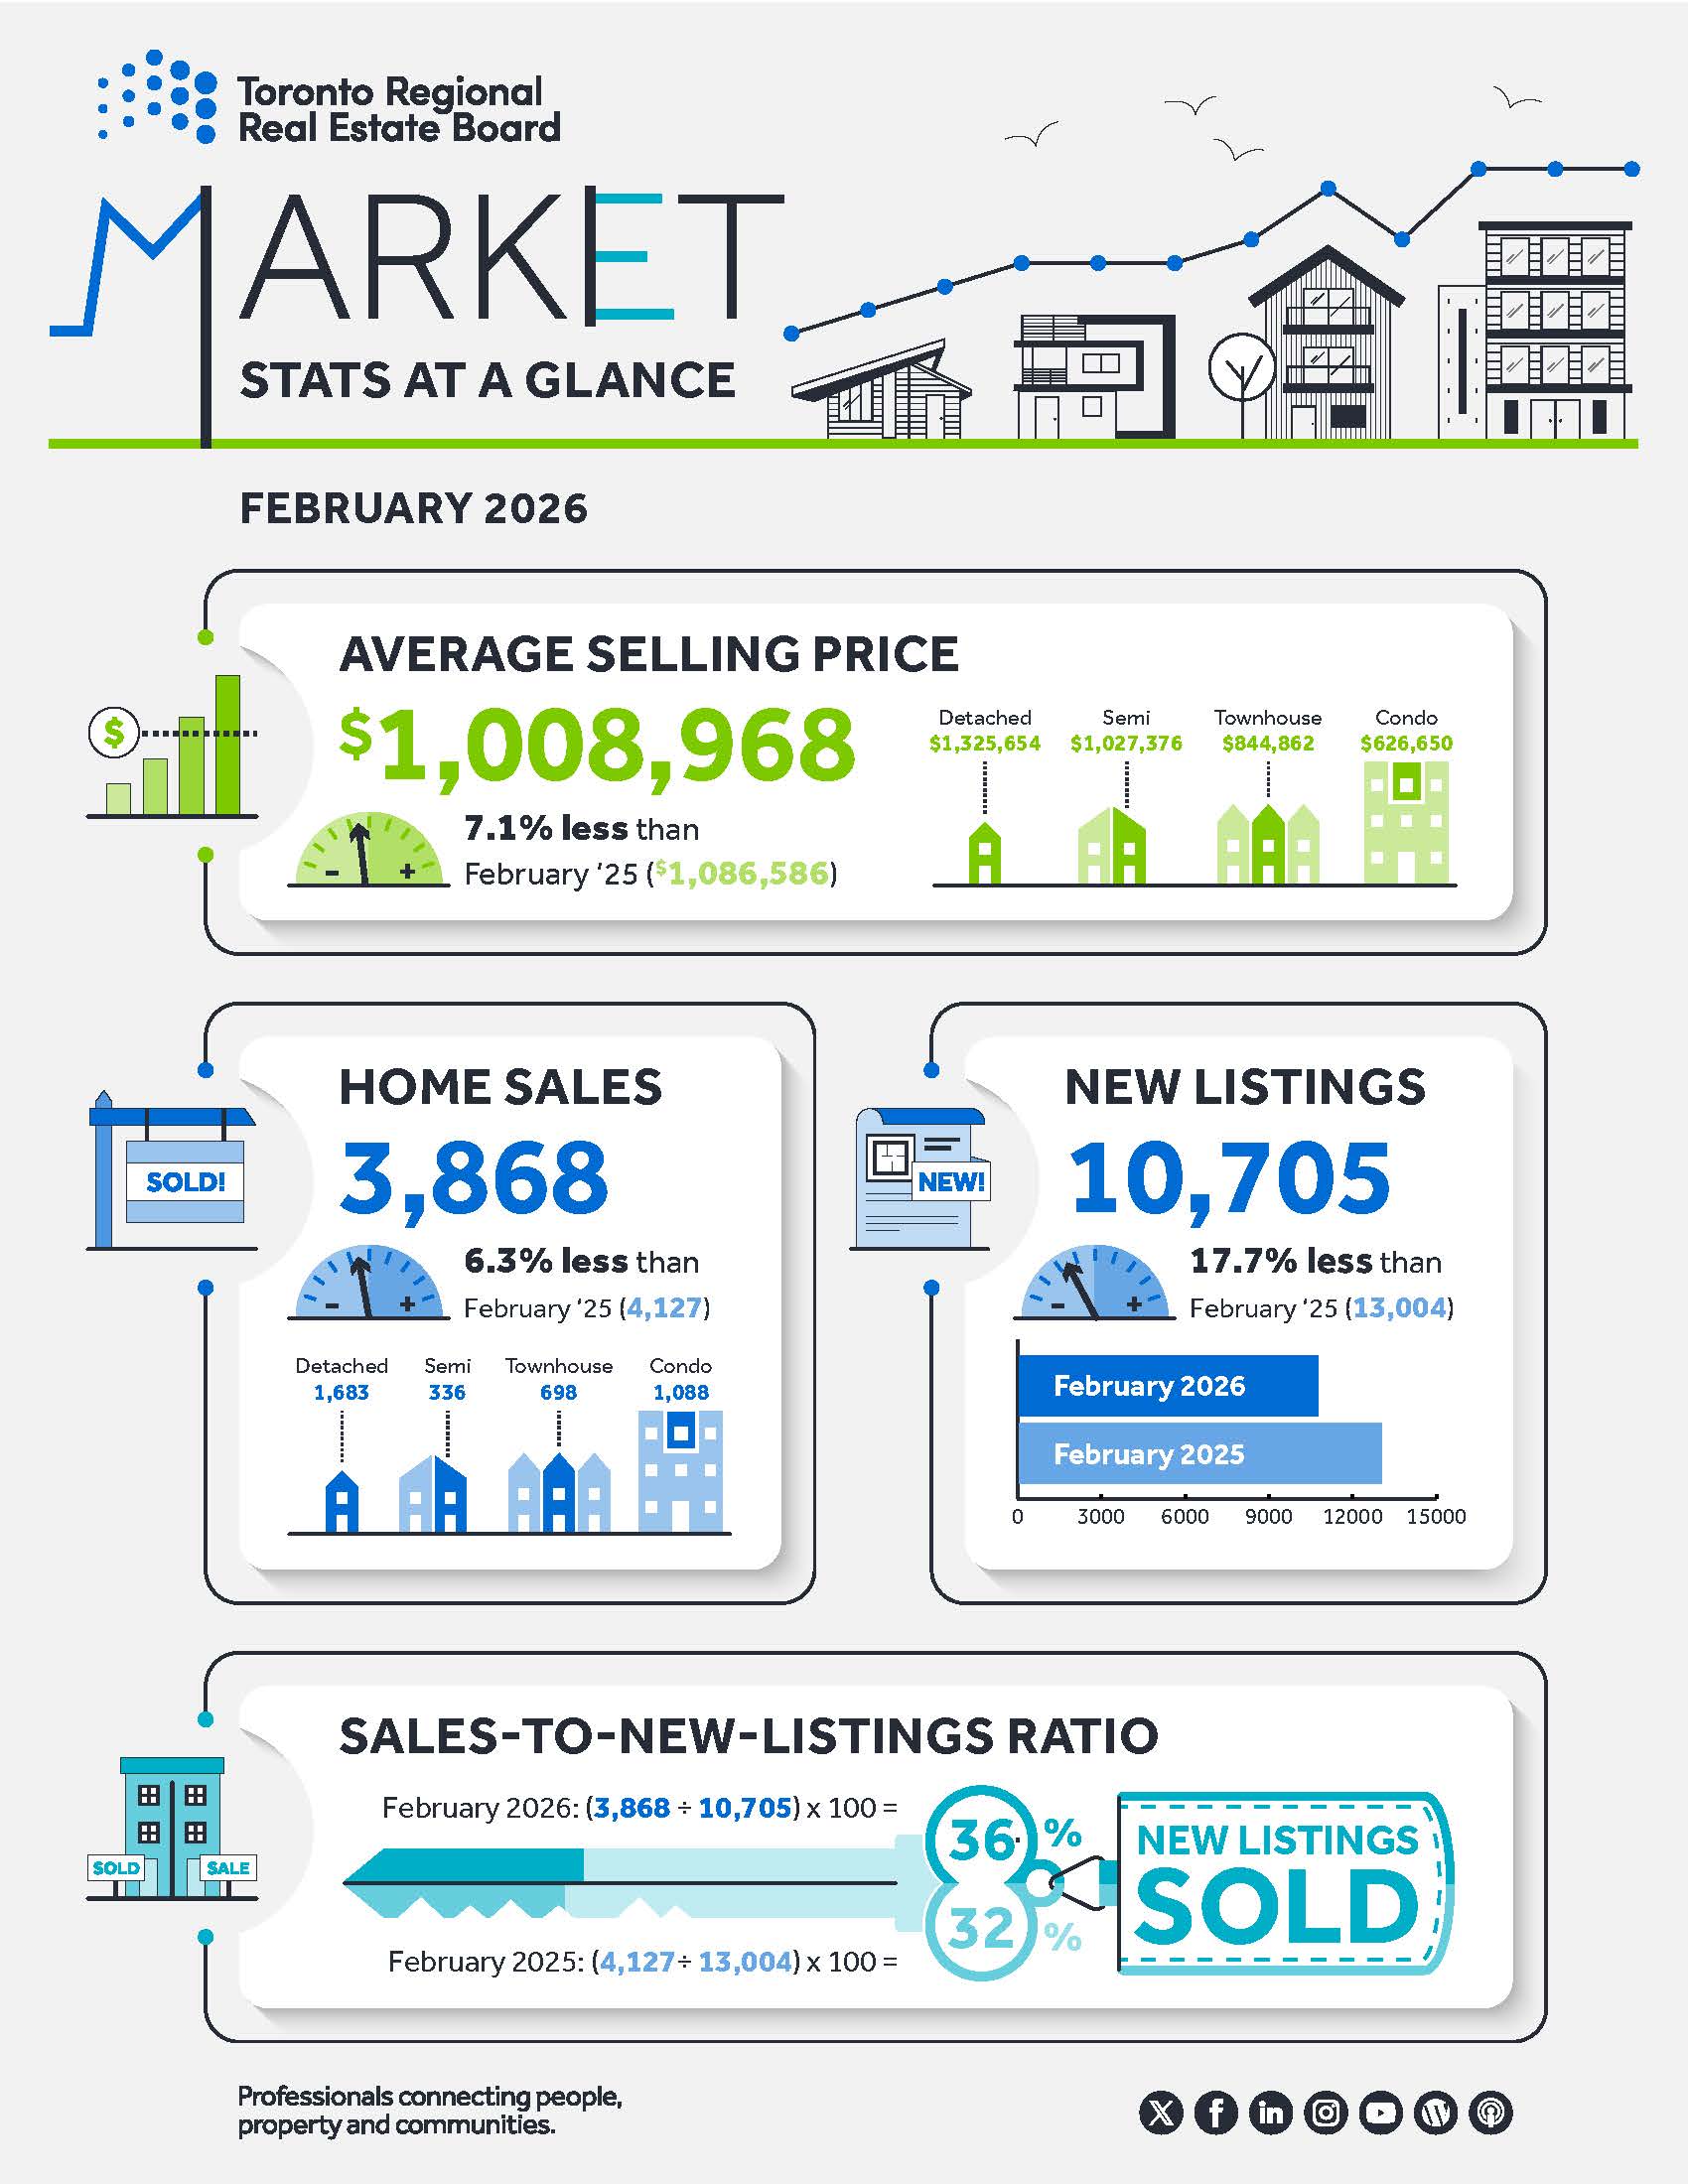


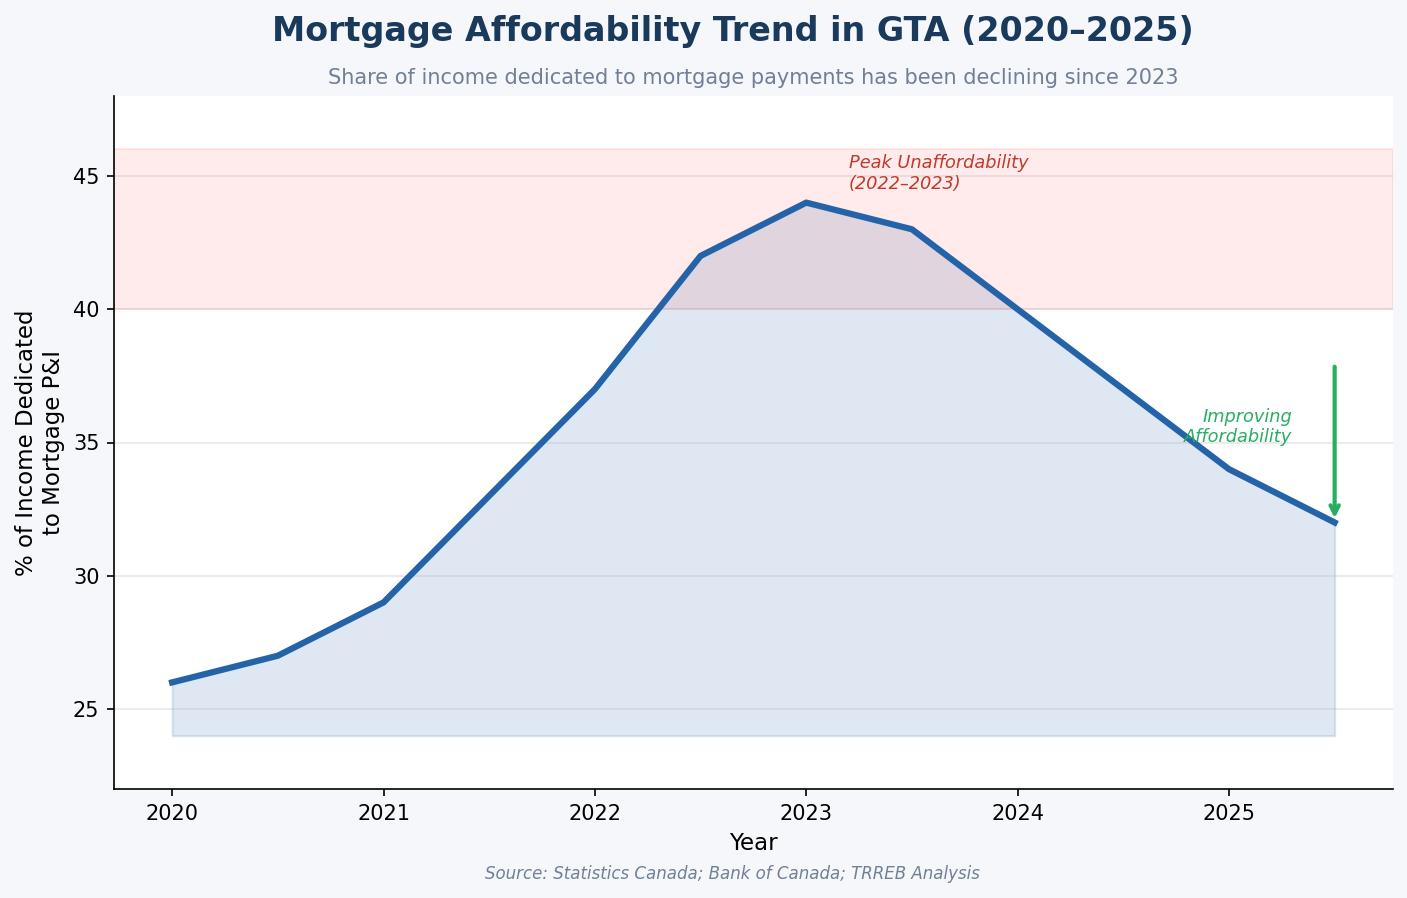
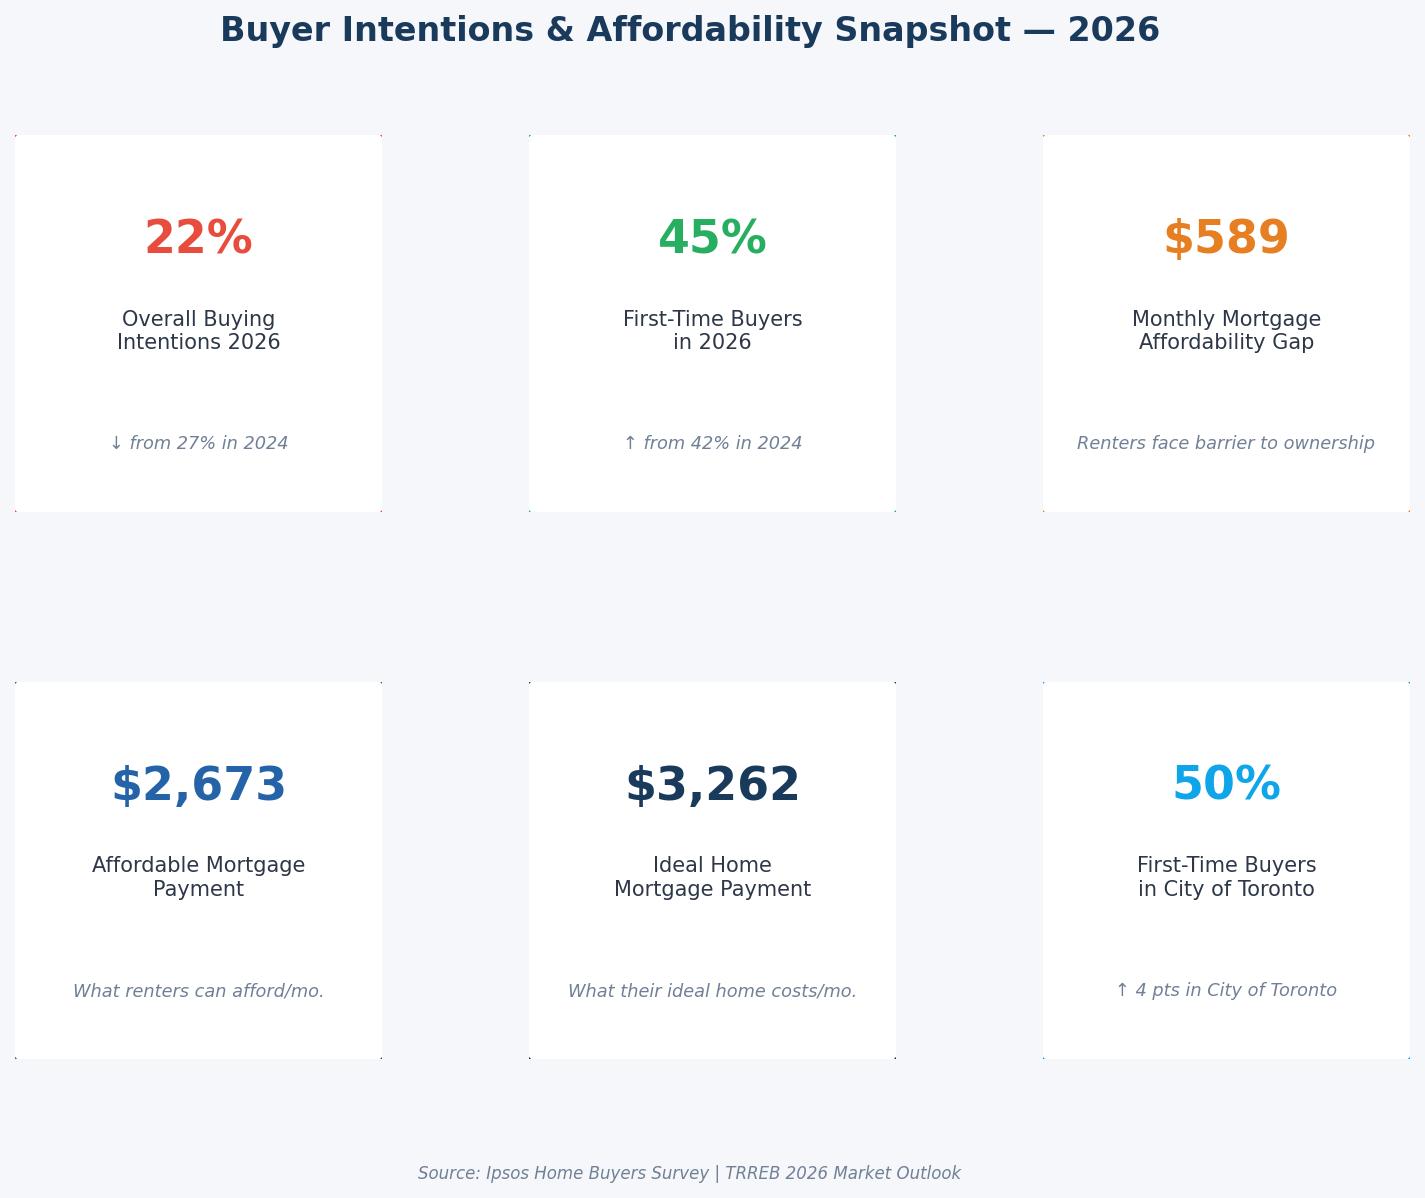
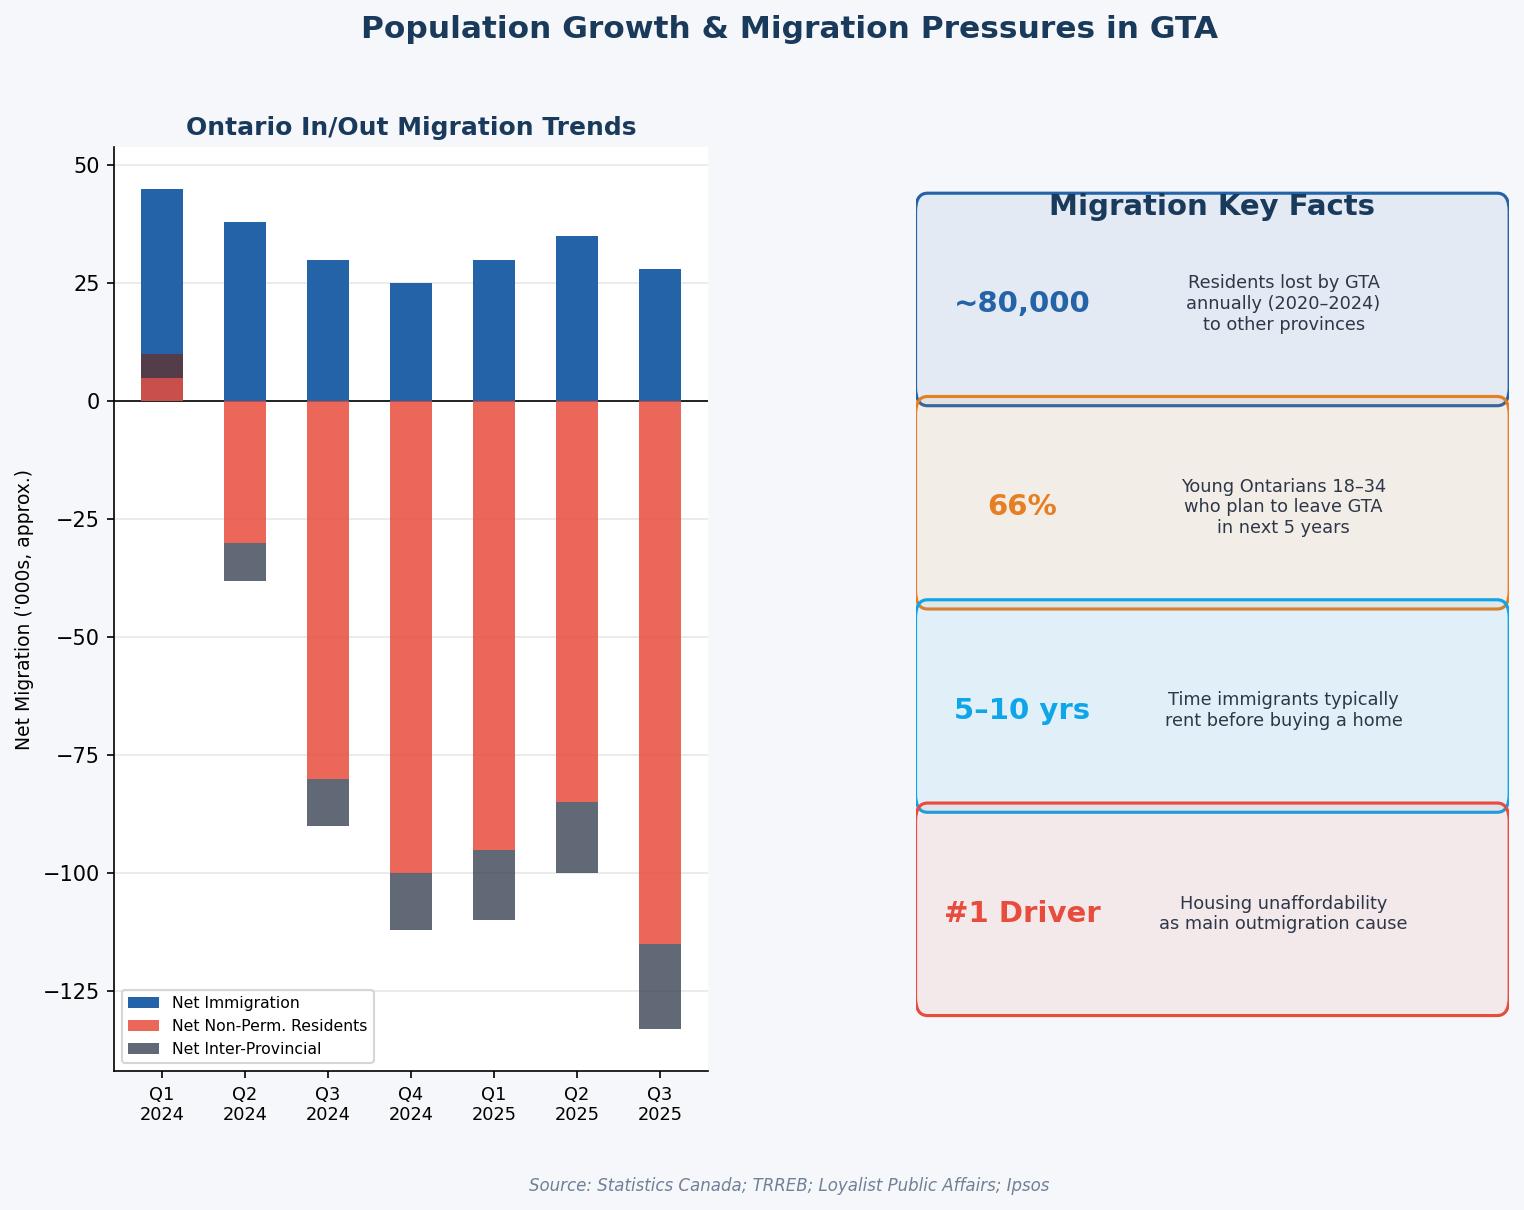
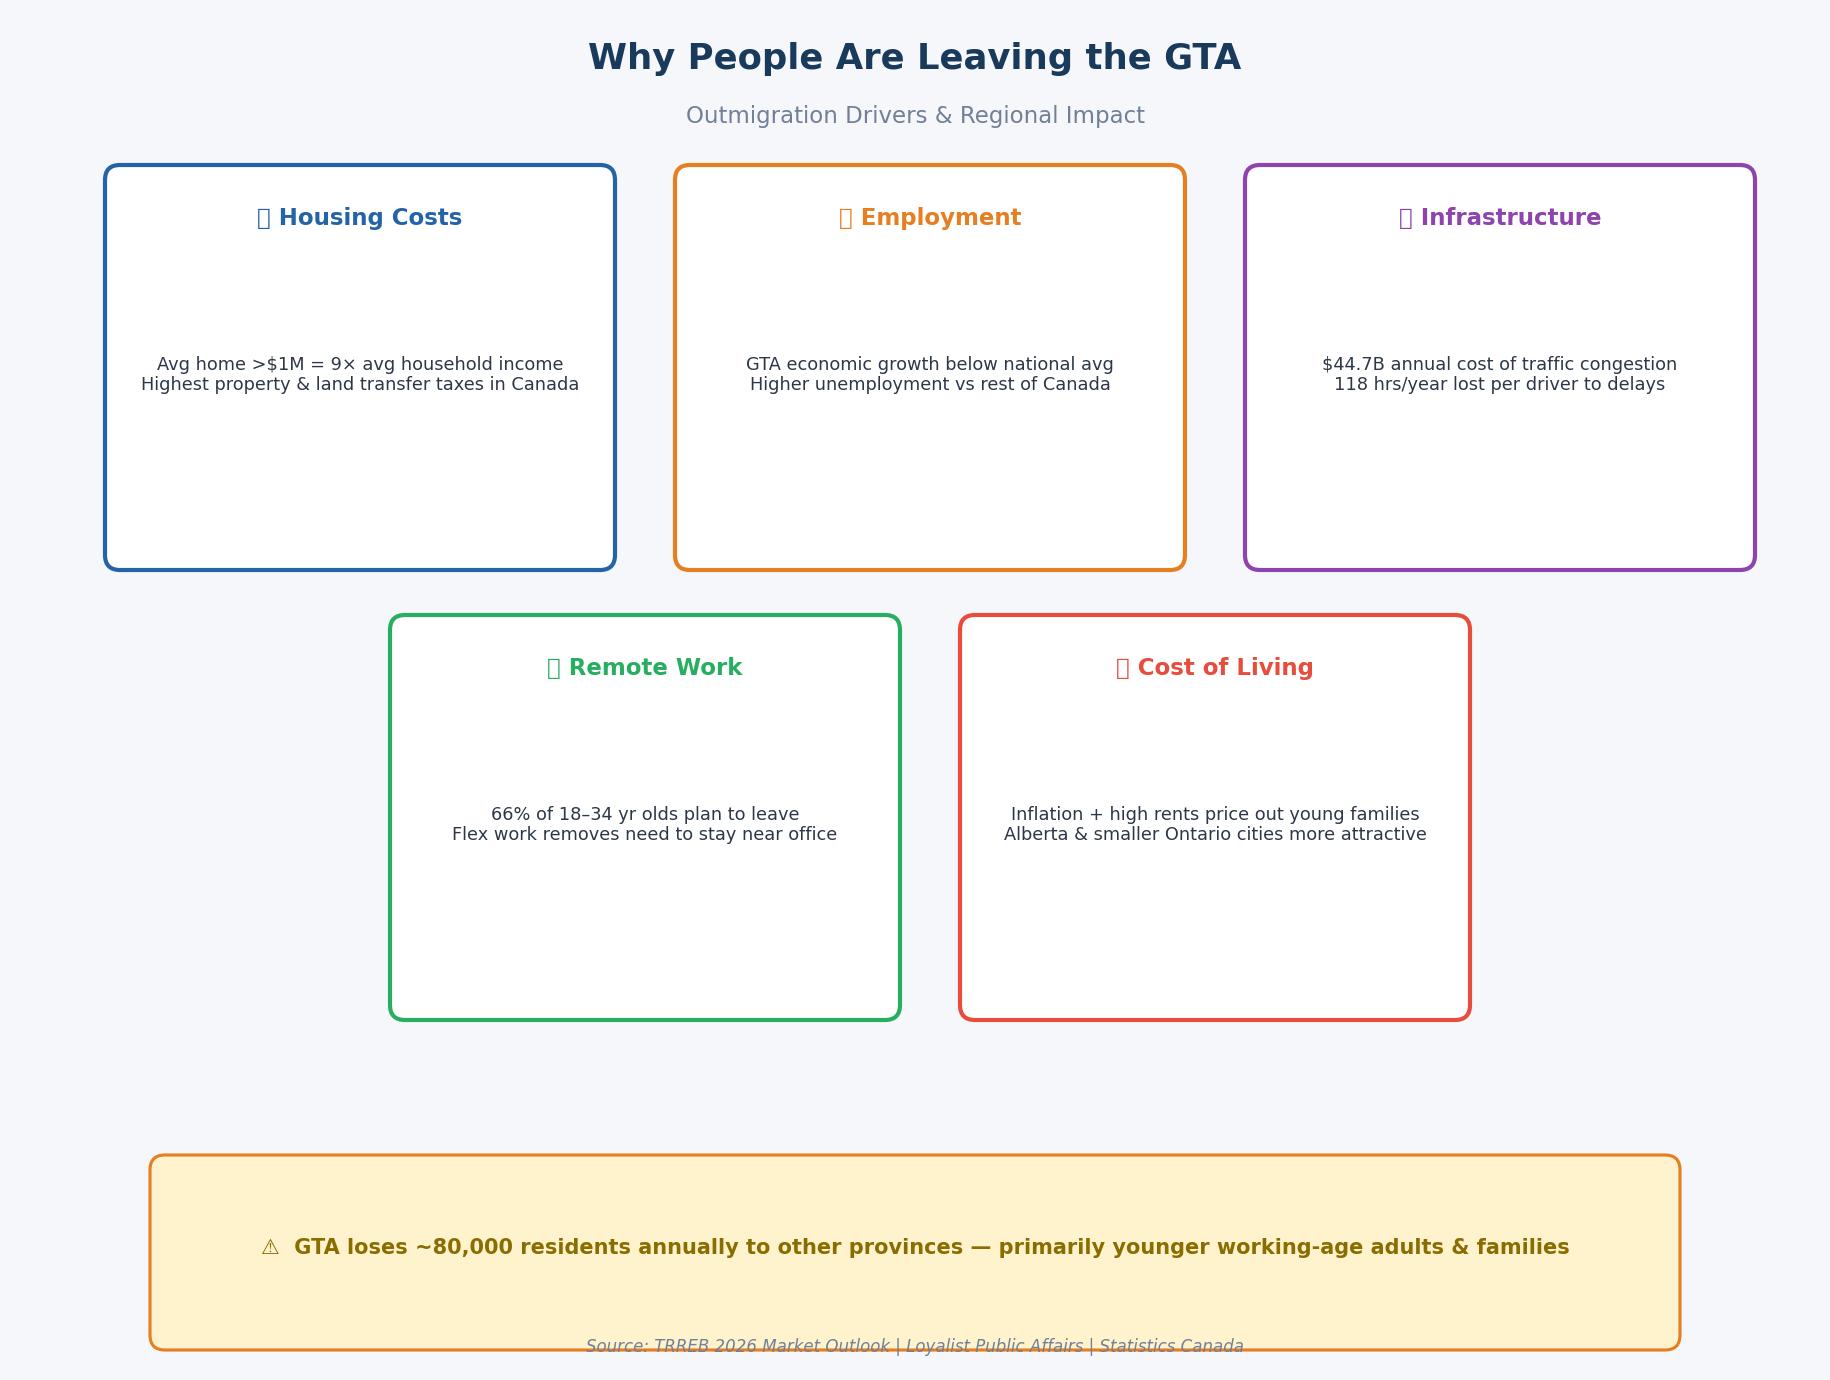
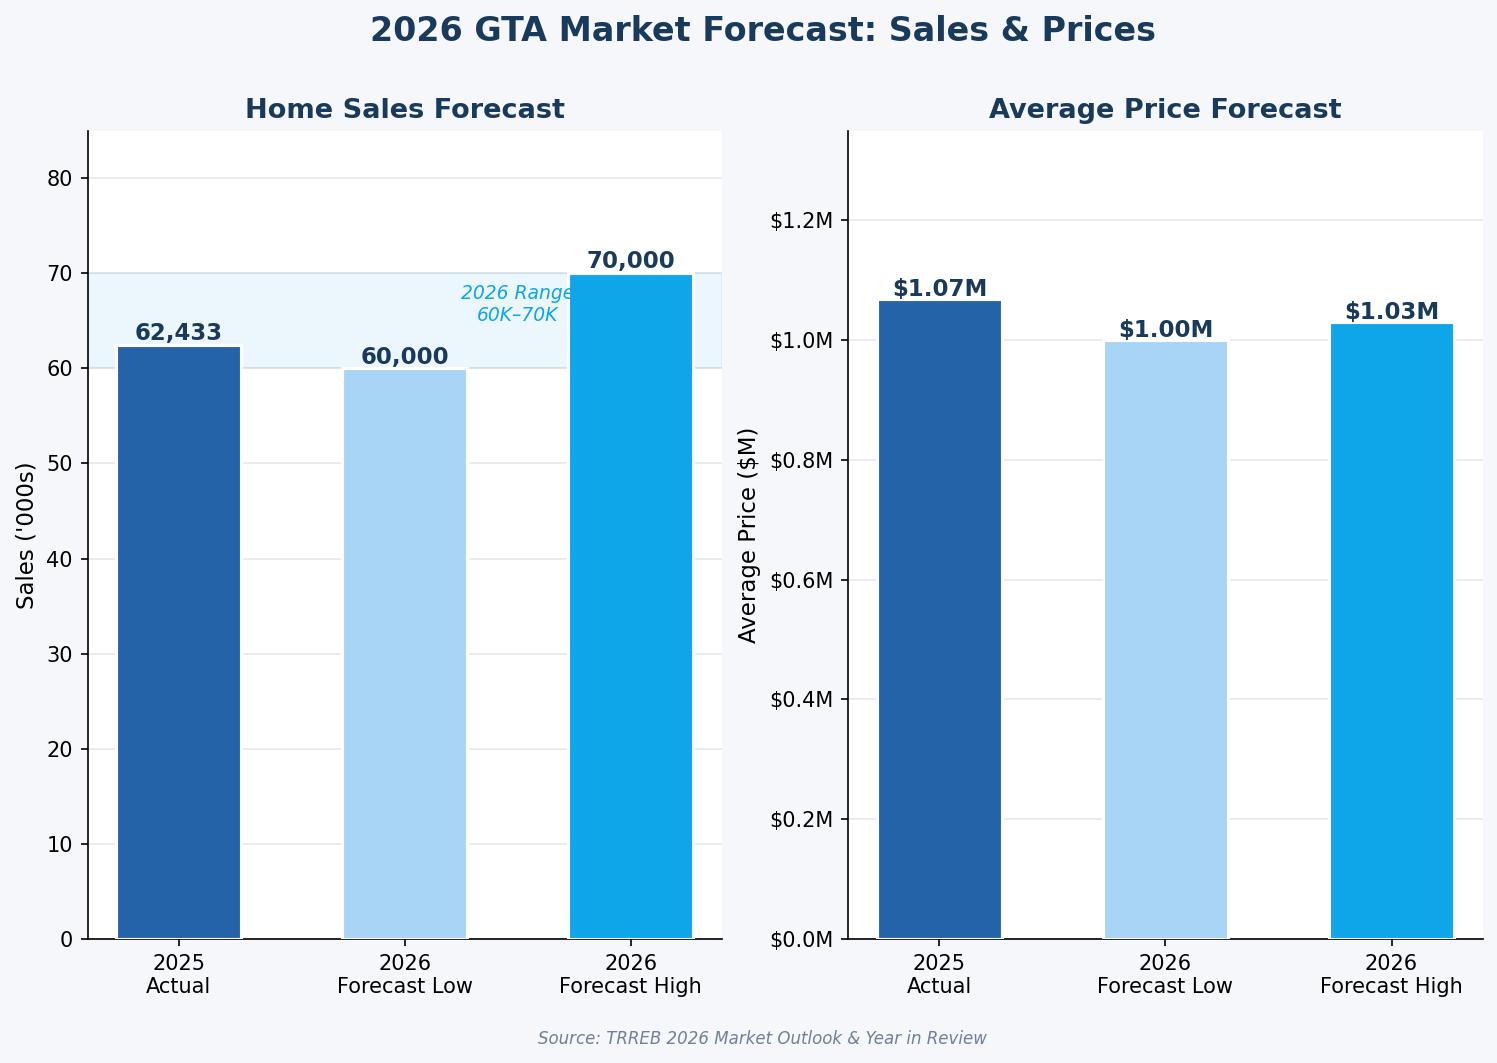 The 2025 residential market was a study in contrasts, characterized by a resilient but normalizing freehold sector and an oversupplied, investor-strained condominium segment.
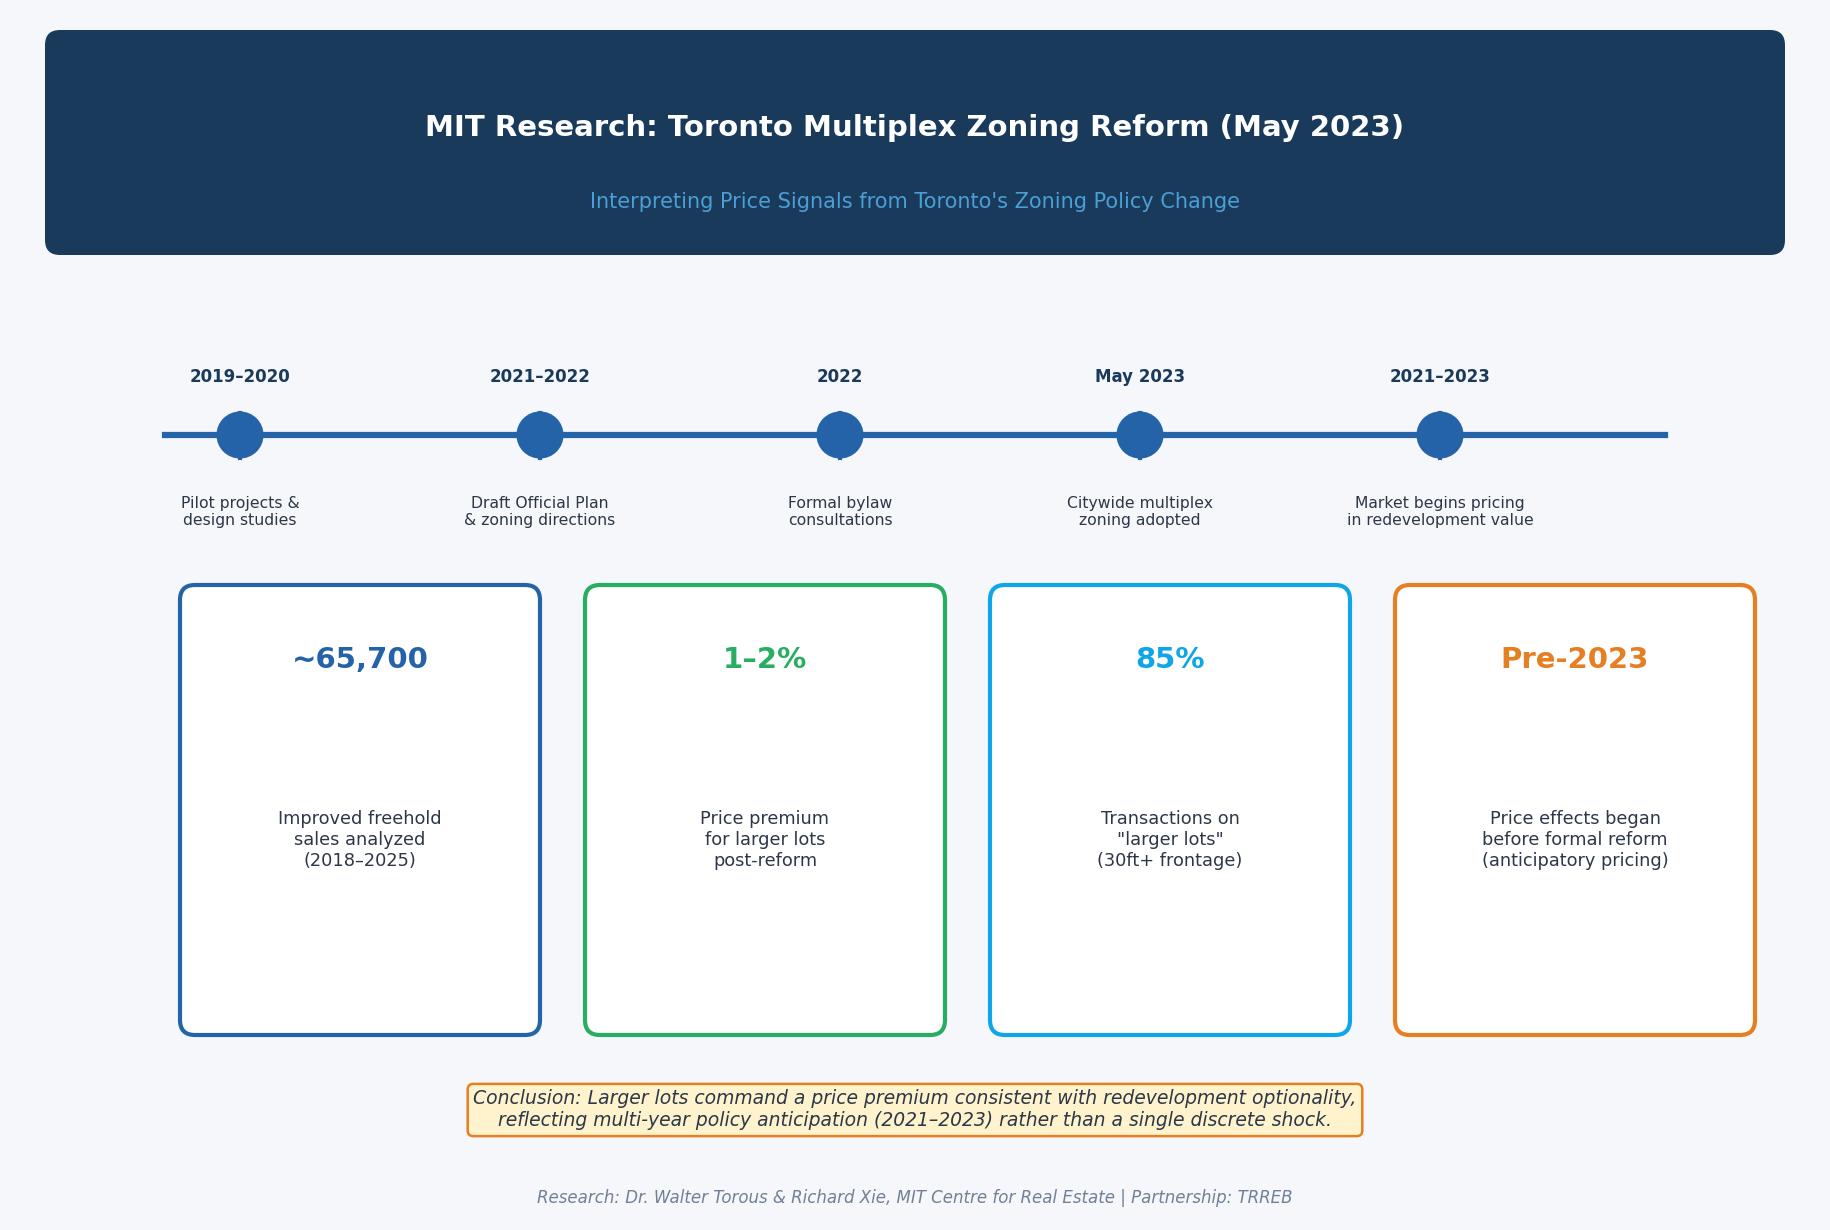
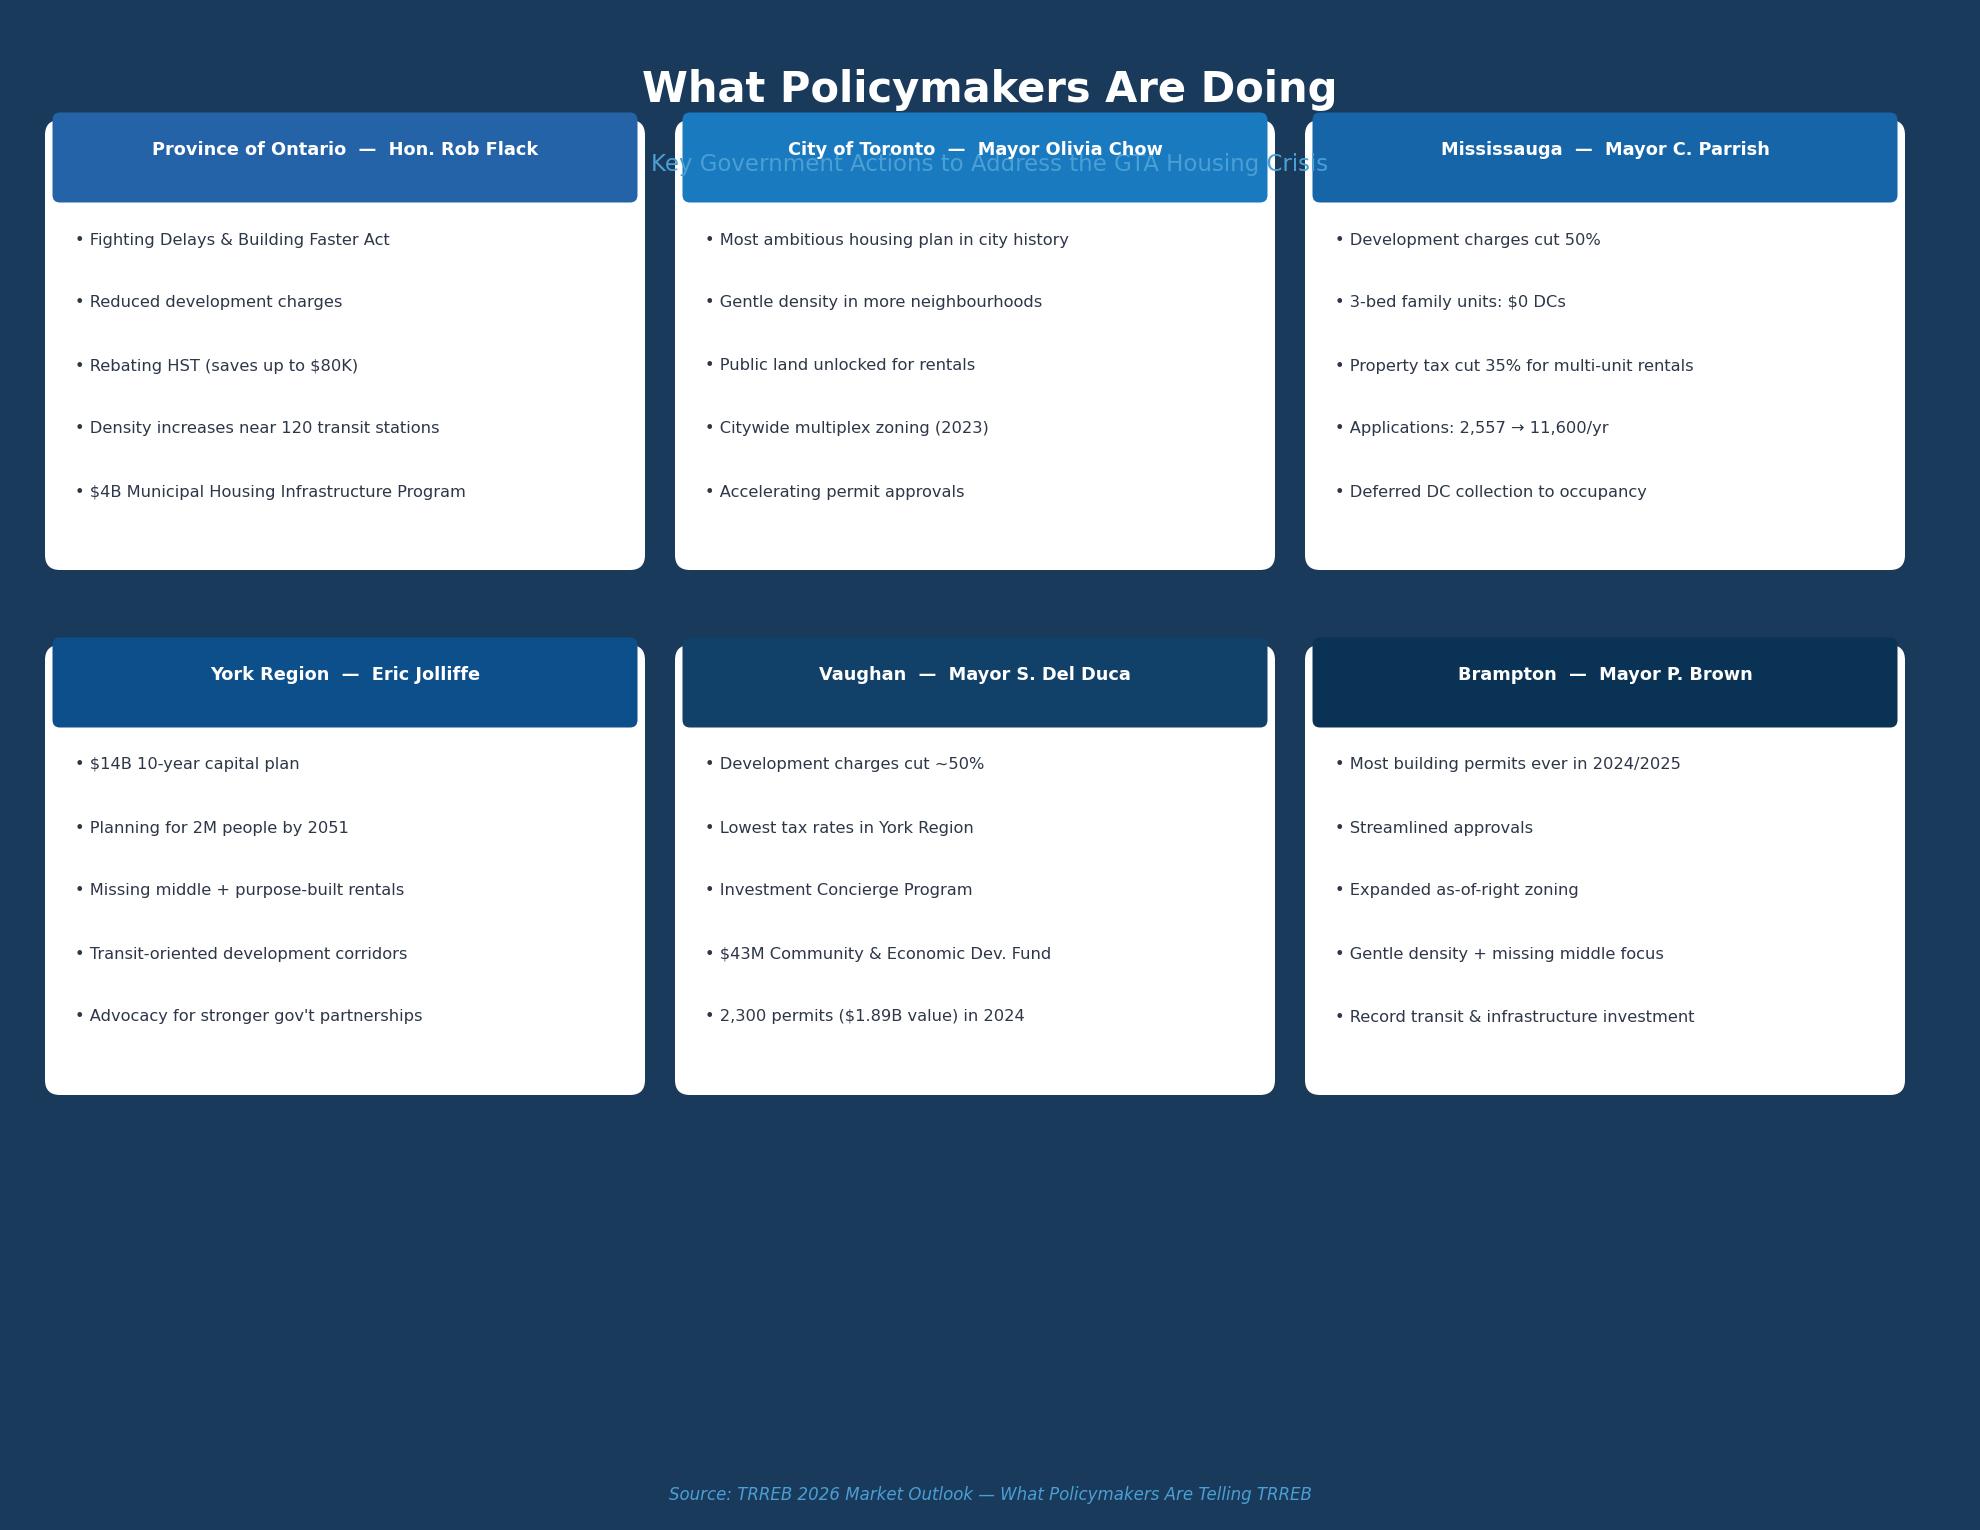
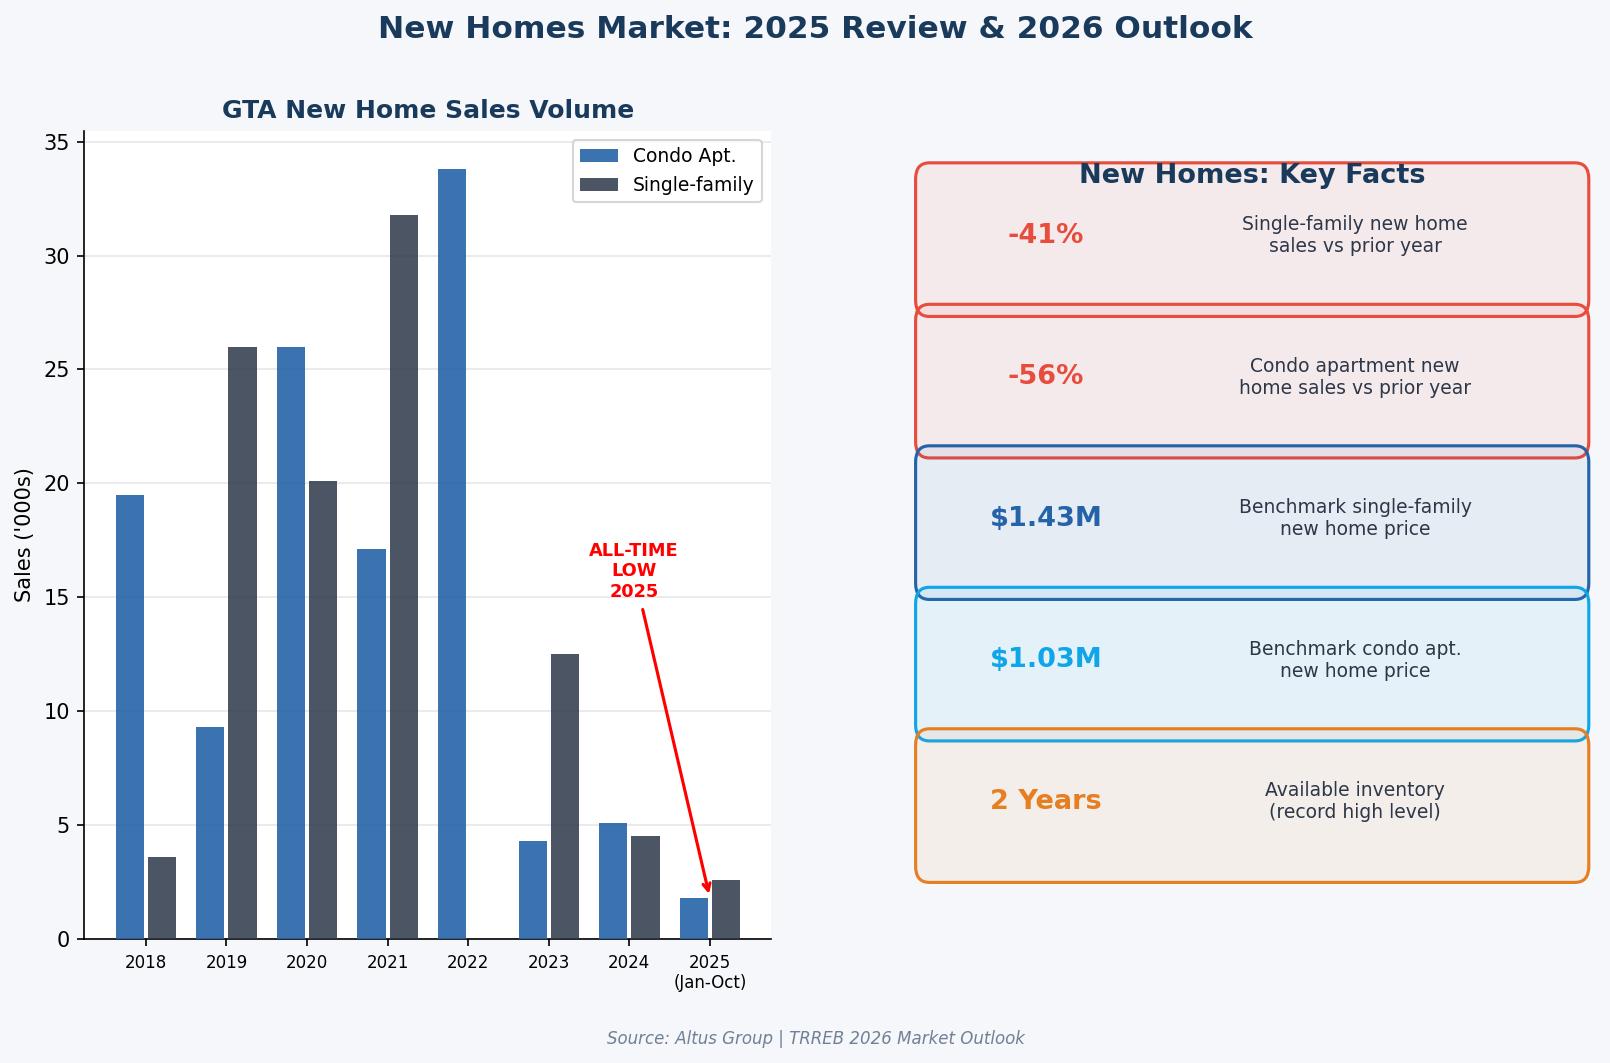 The Burden of Development Charges
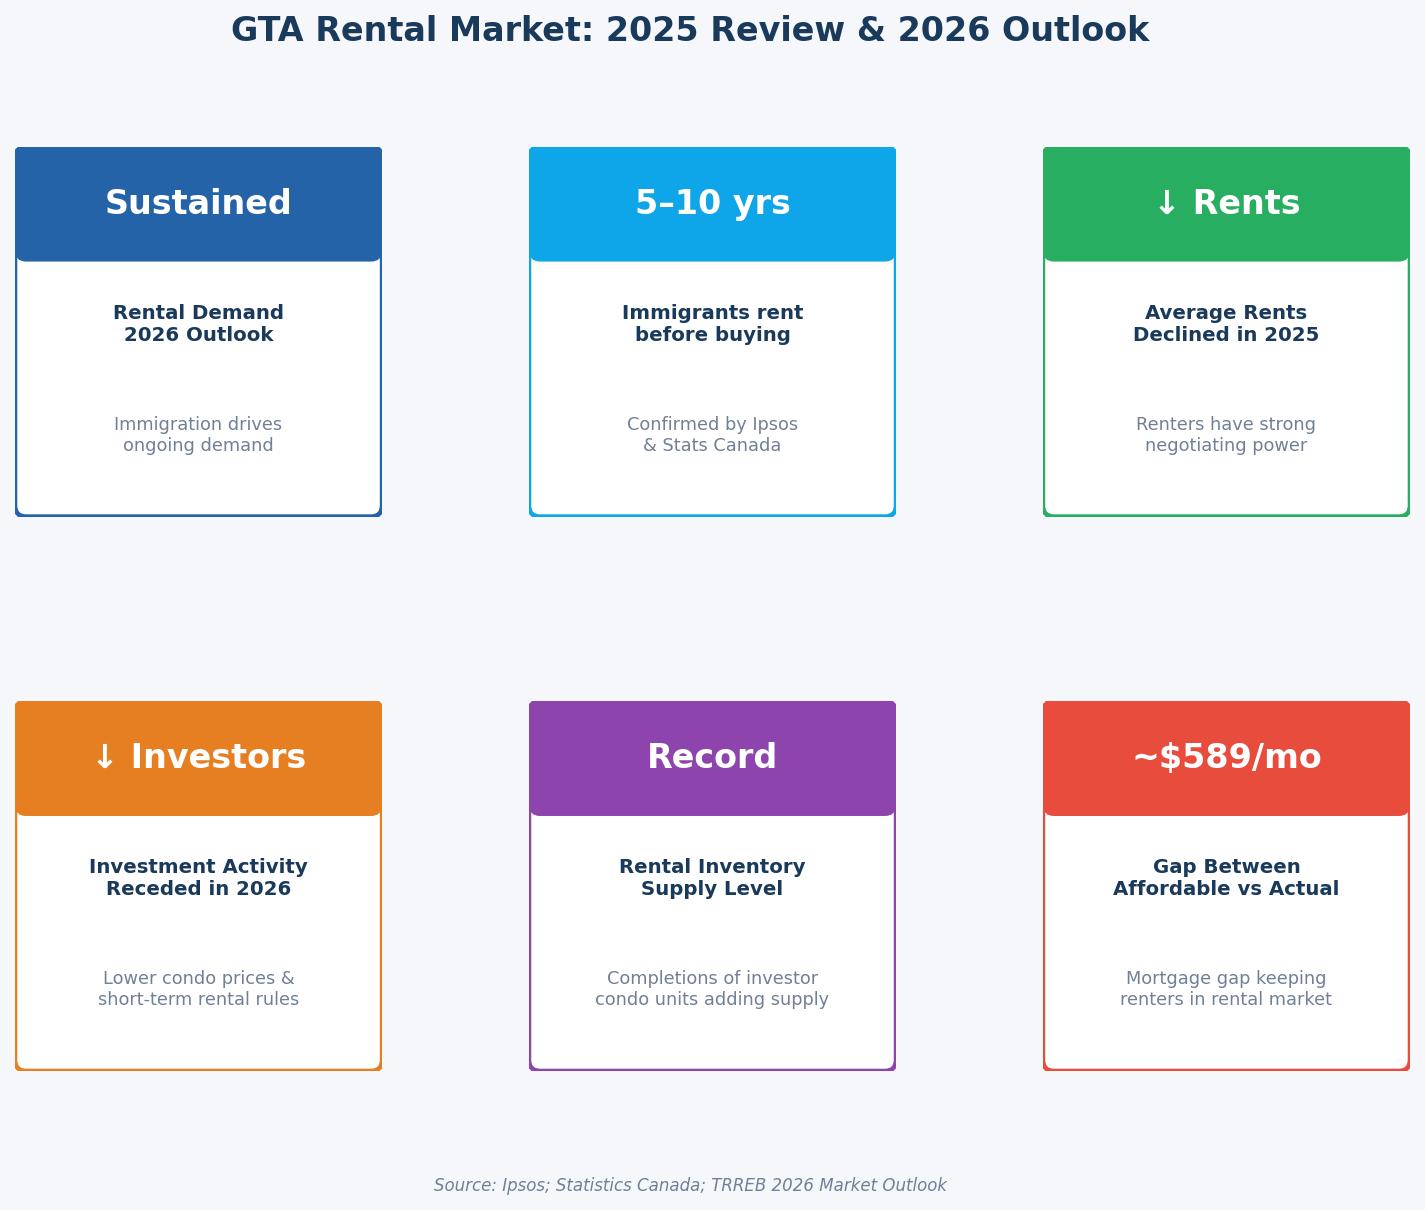
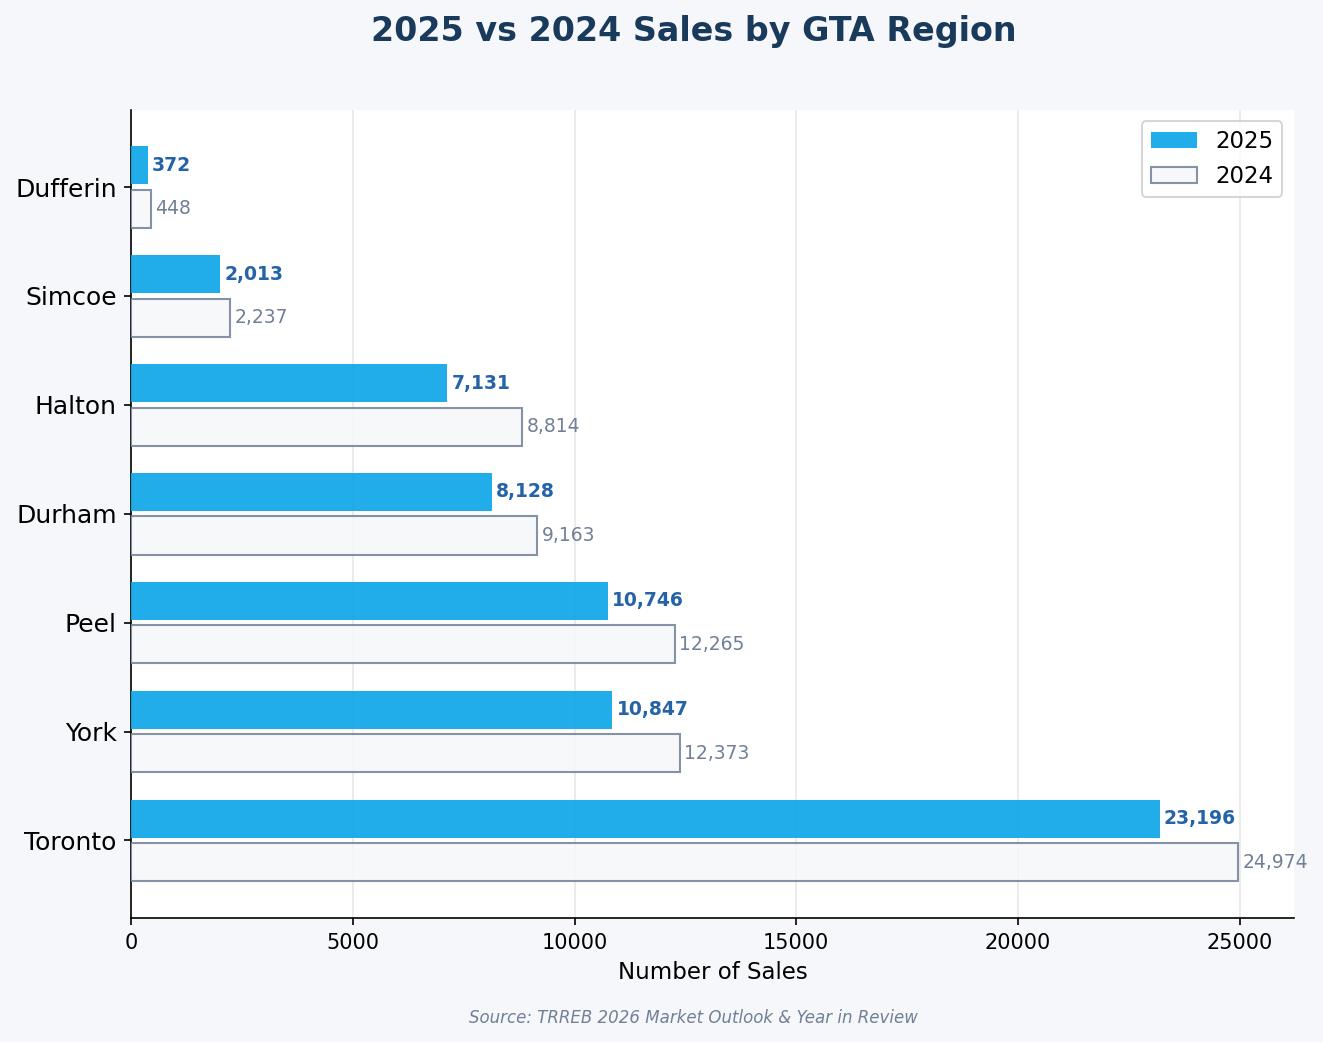
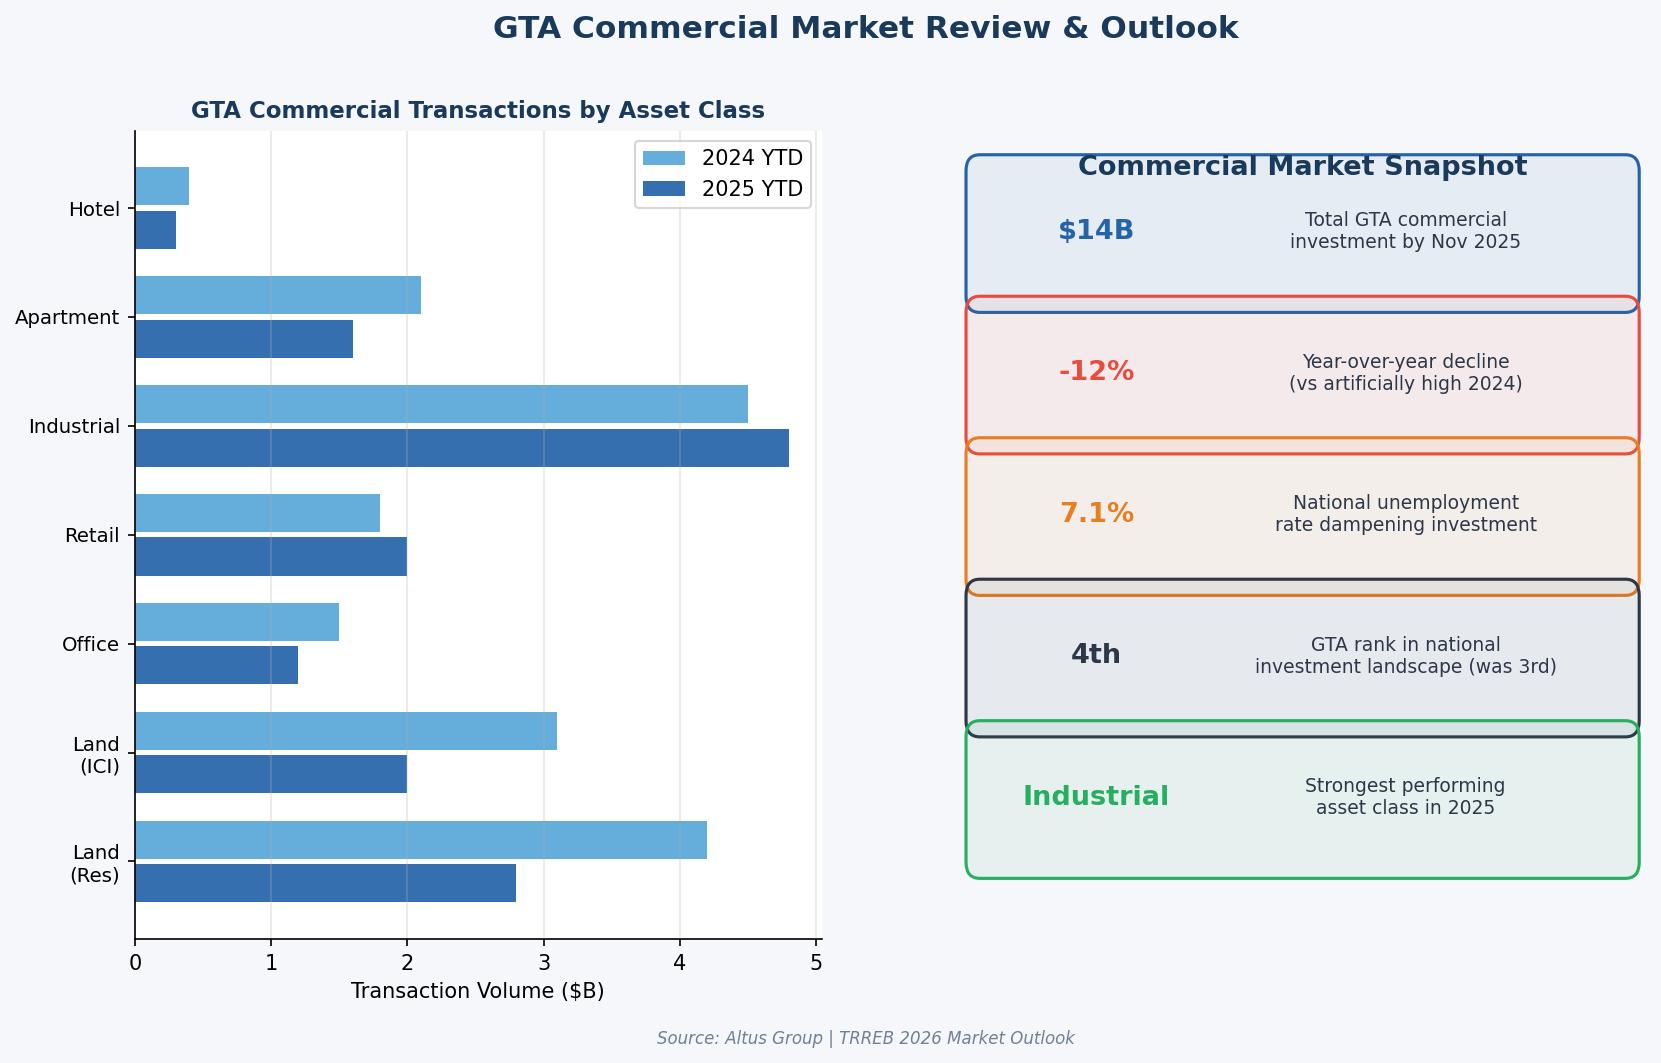
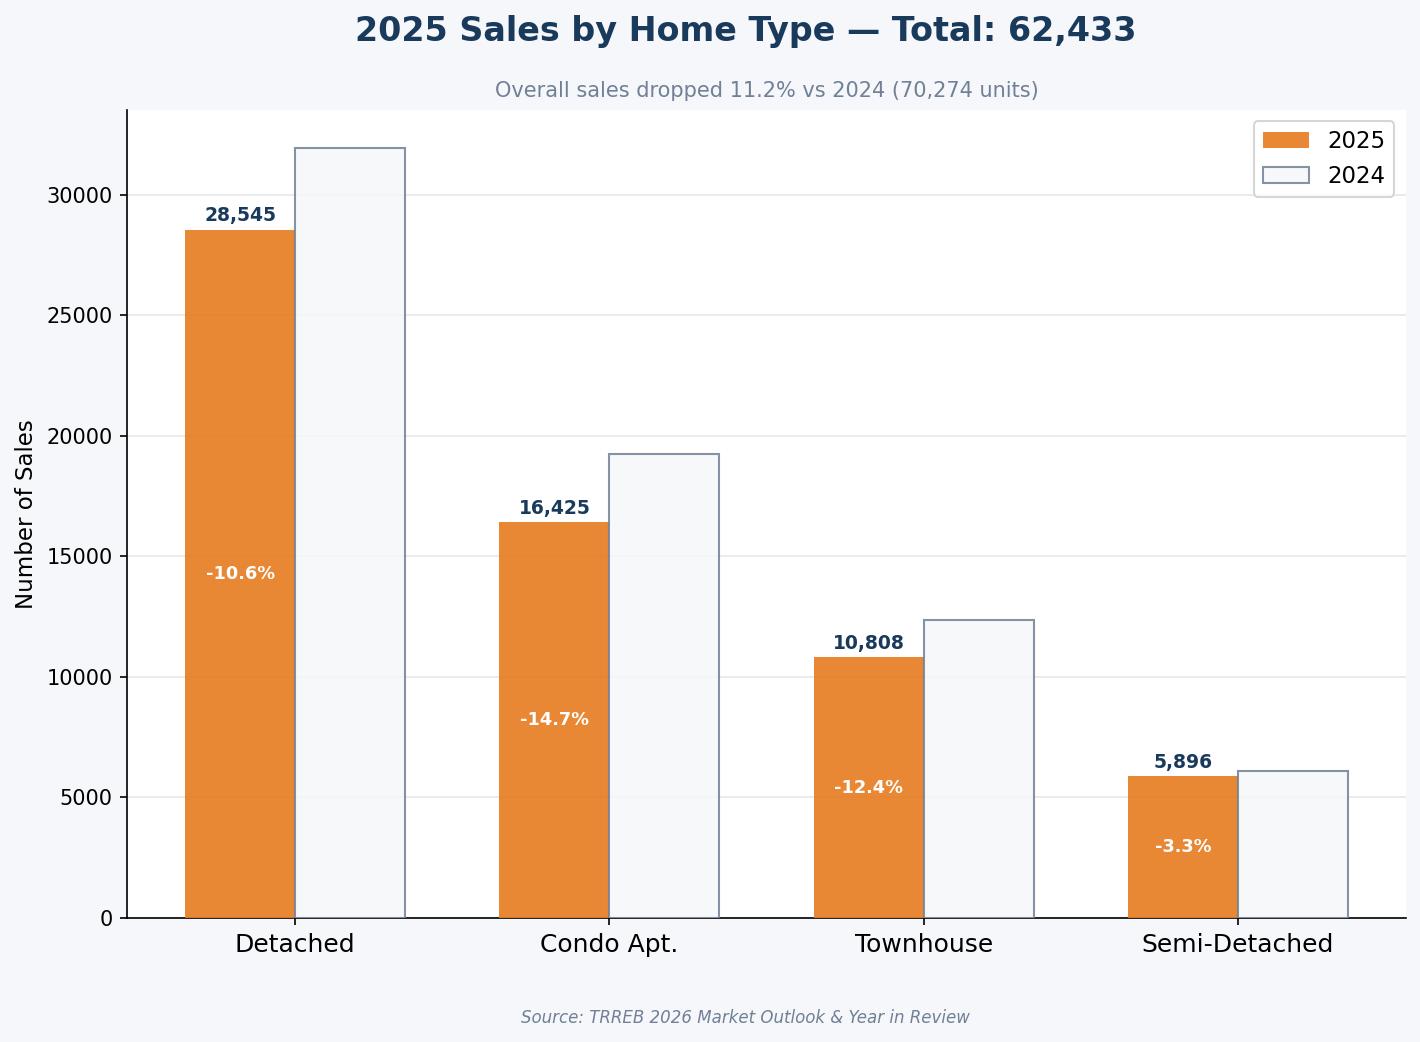 In 2025, the GTA market shifted into a “balanced” state, with significant pockets of “buyer’s market” conditions, particularly in the condominium and entry-level freehold segments. Inventory reached levels not seen since 2009, granting buyers unprecedented power to include conditions and negotiate prices below list.
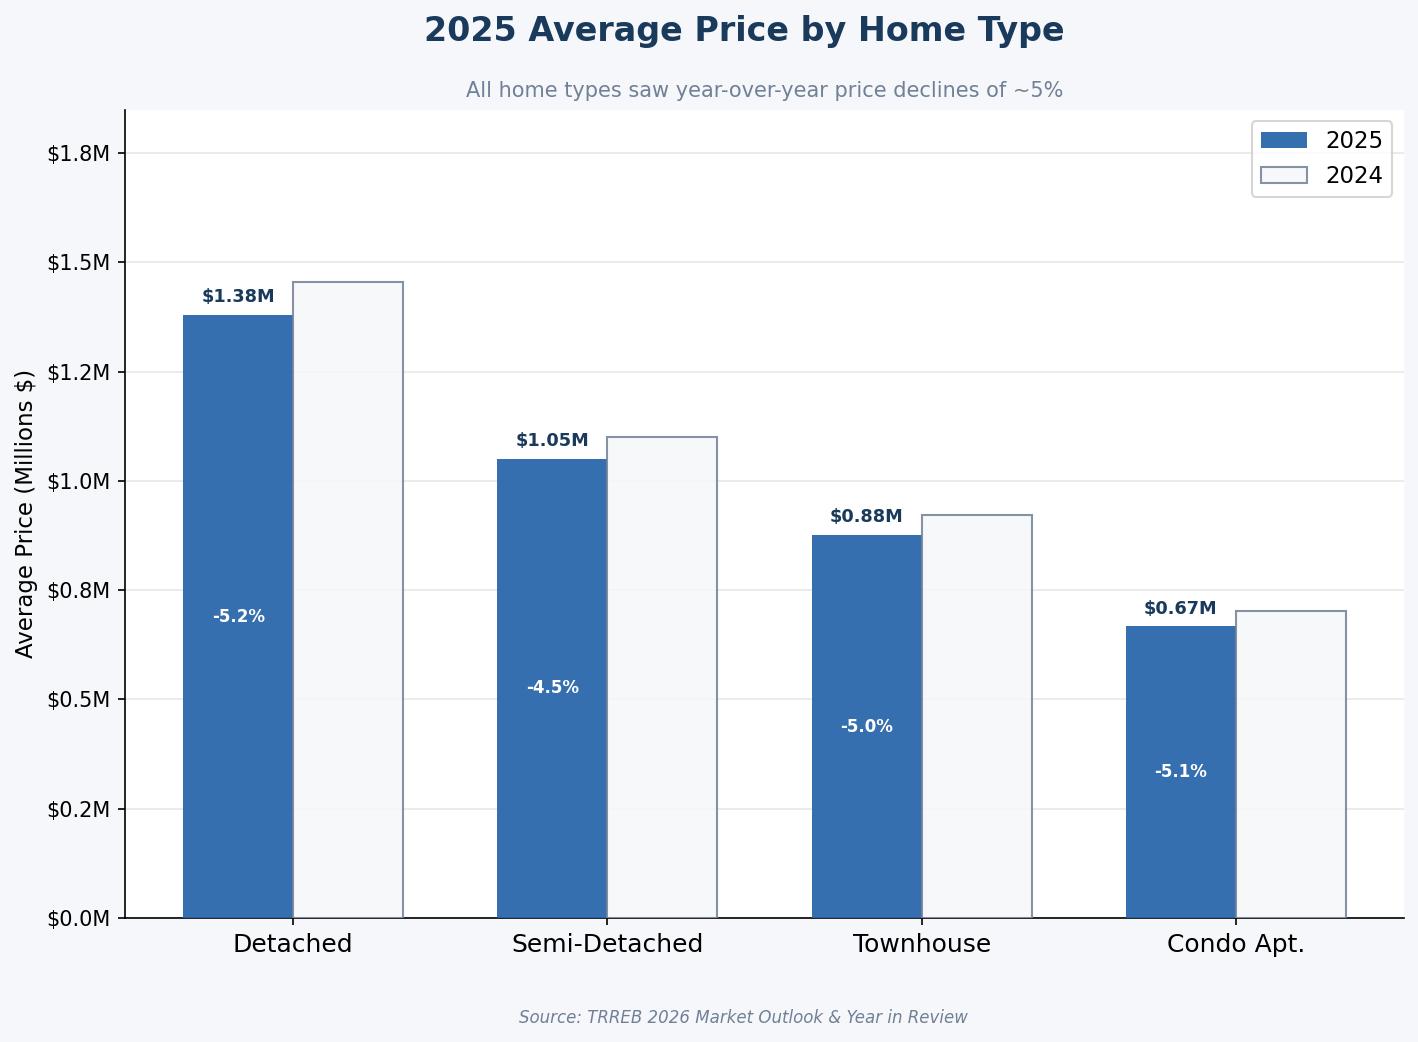 Across the entire GTA, the average selling price for all home types in 2025 was approximately $
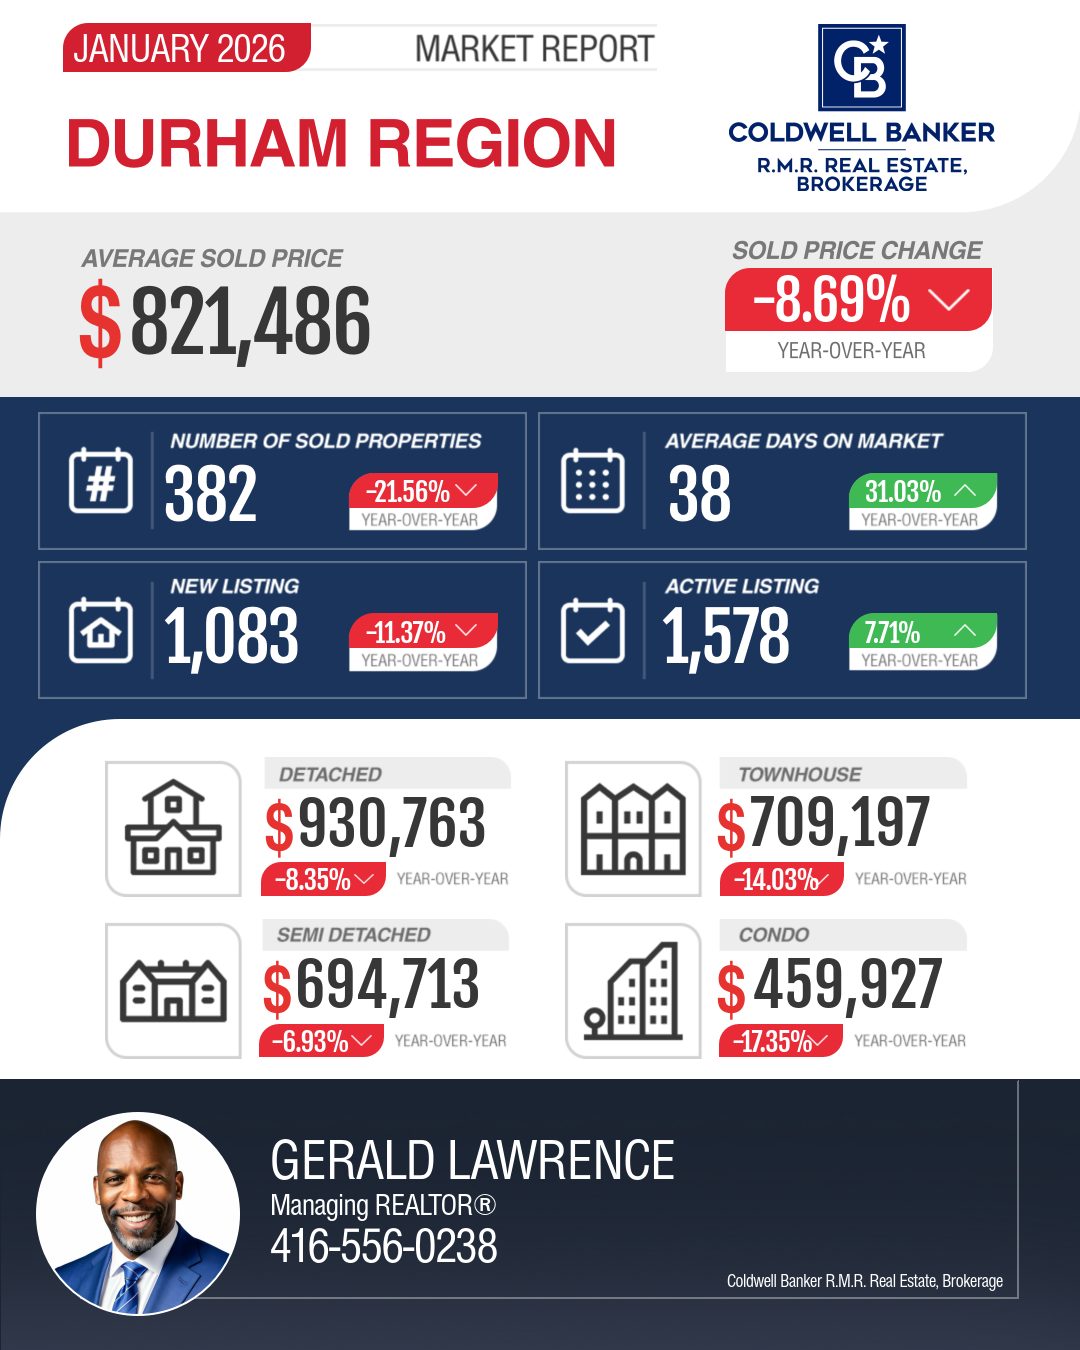


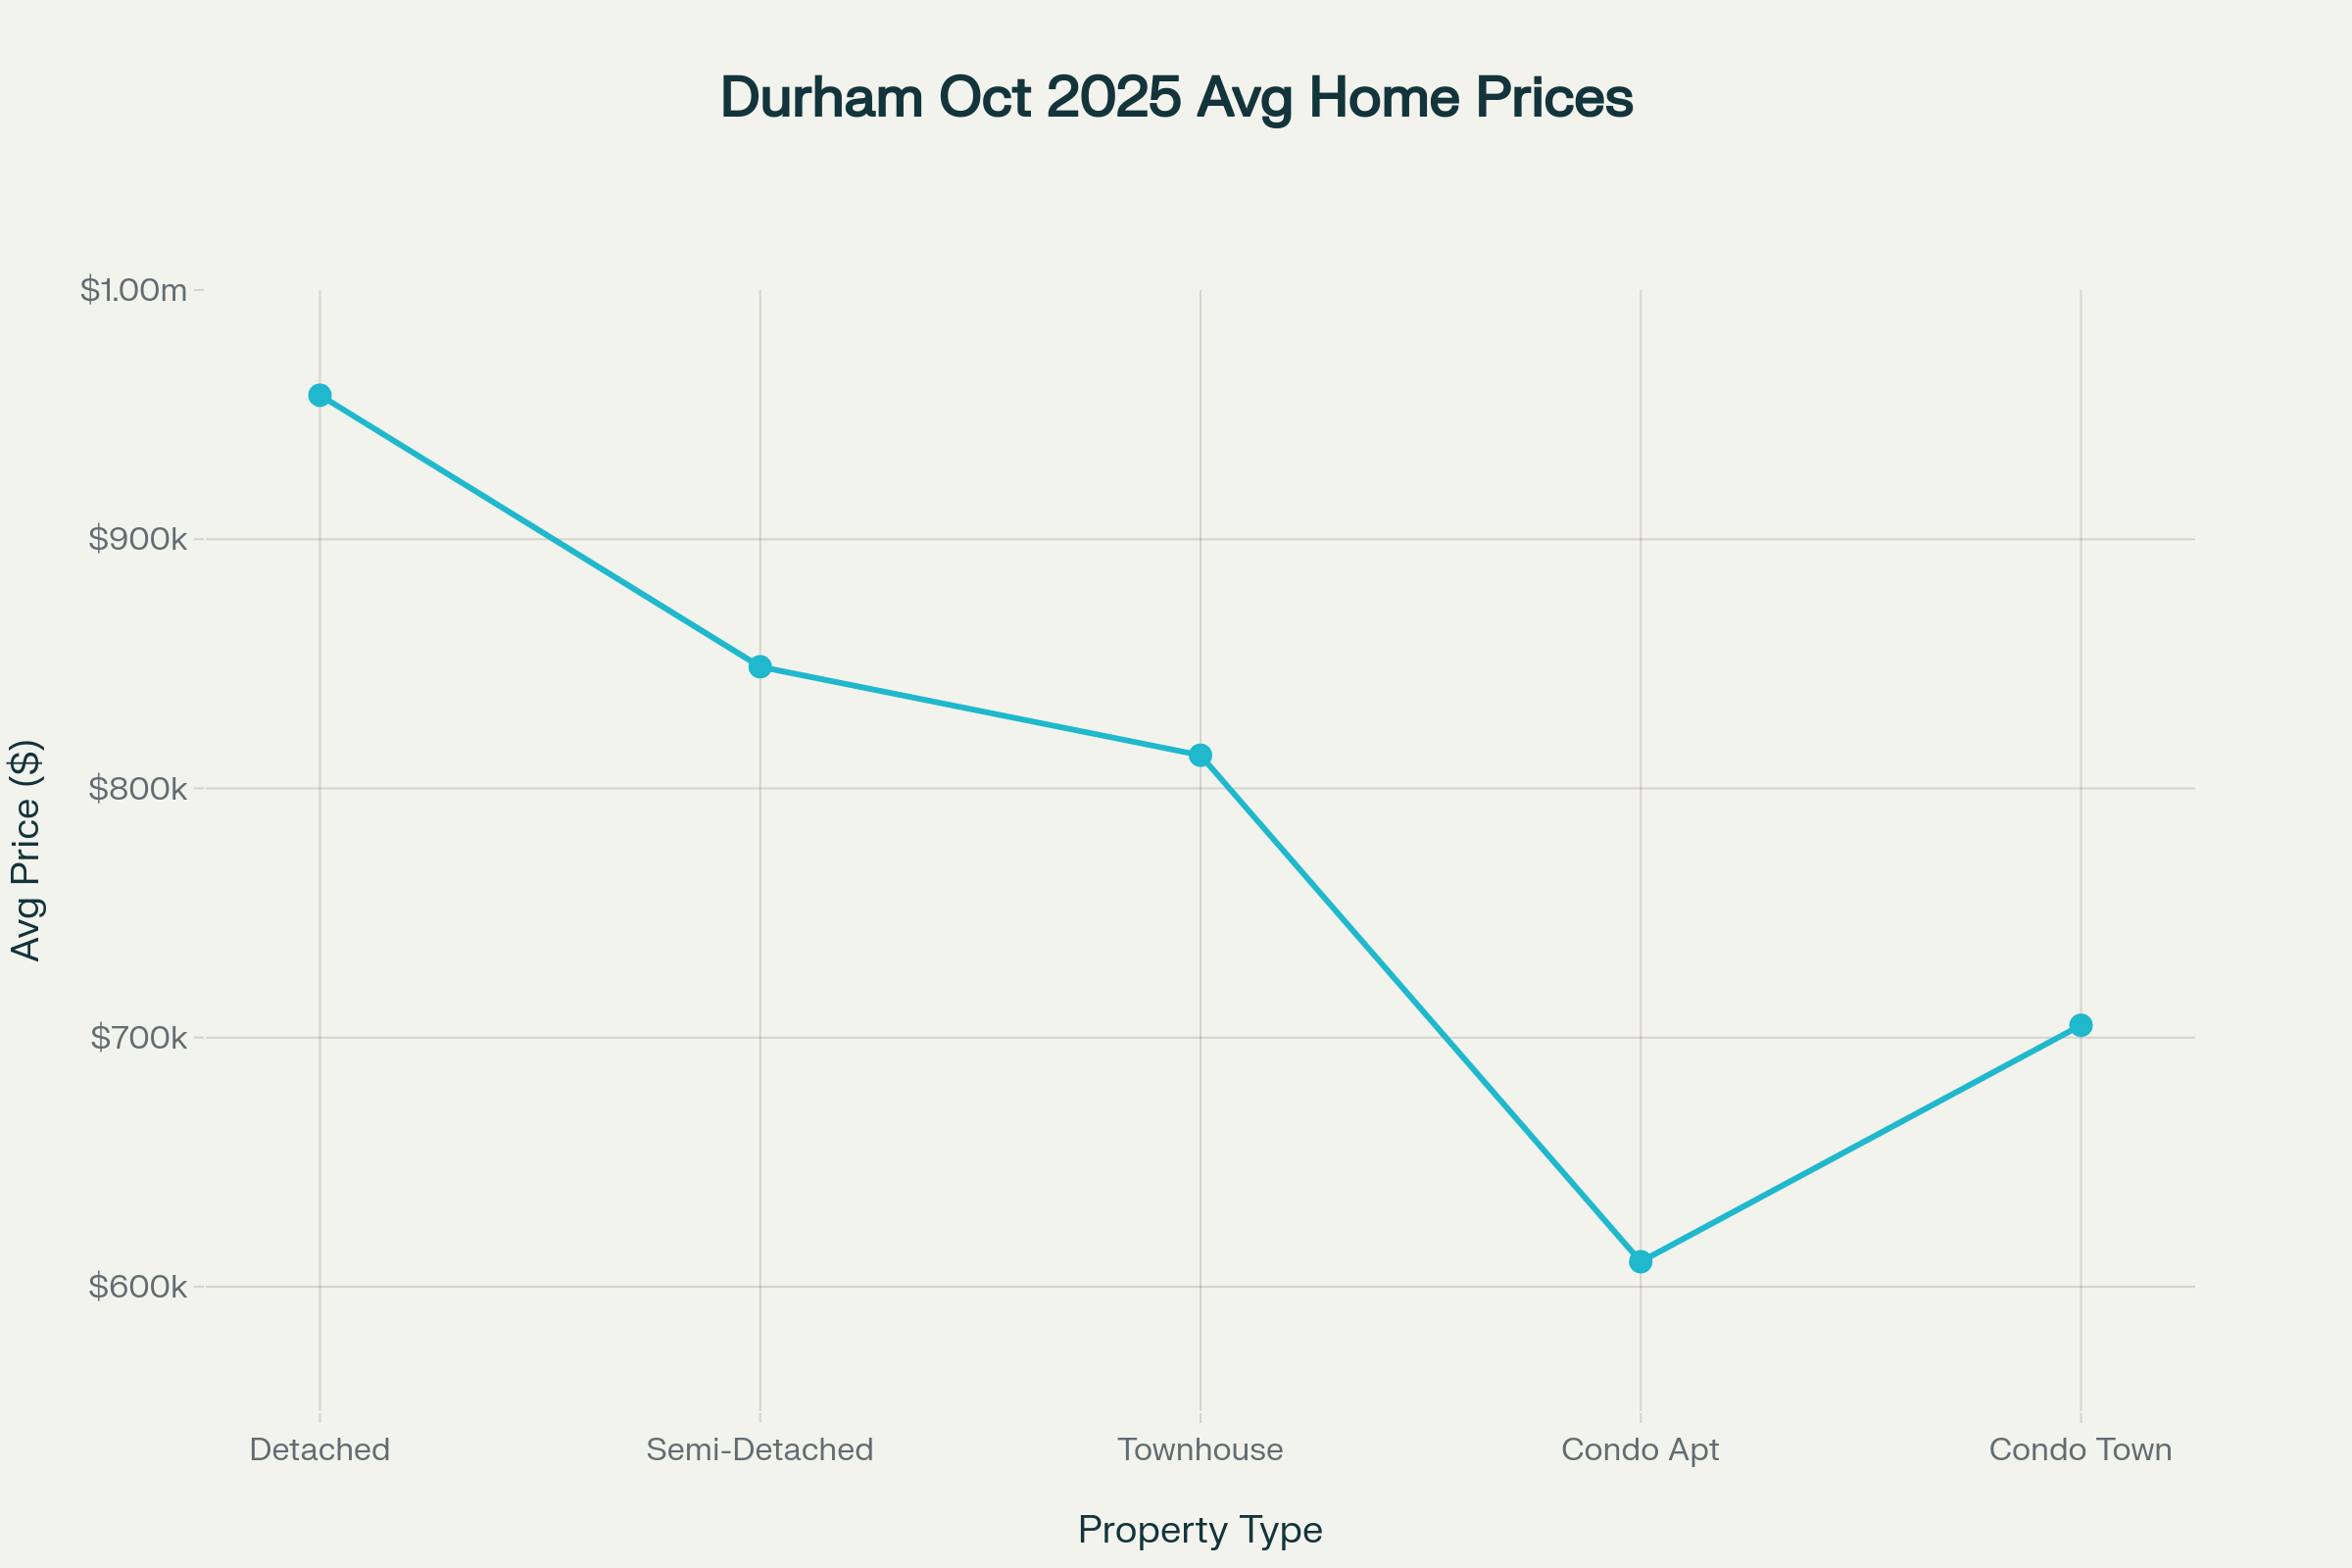
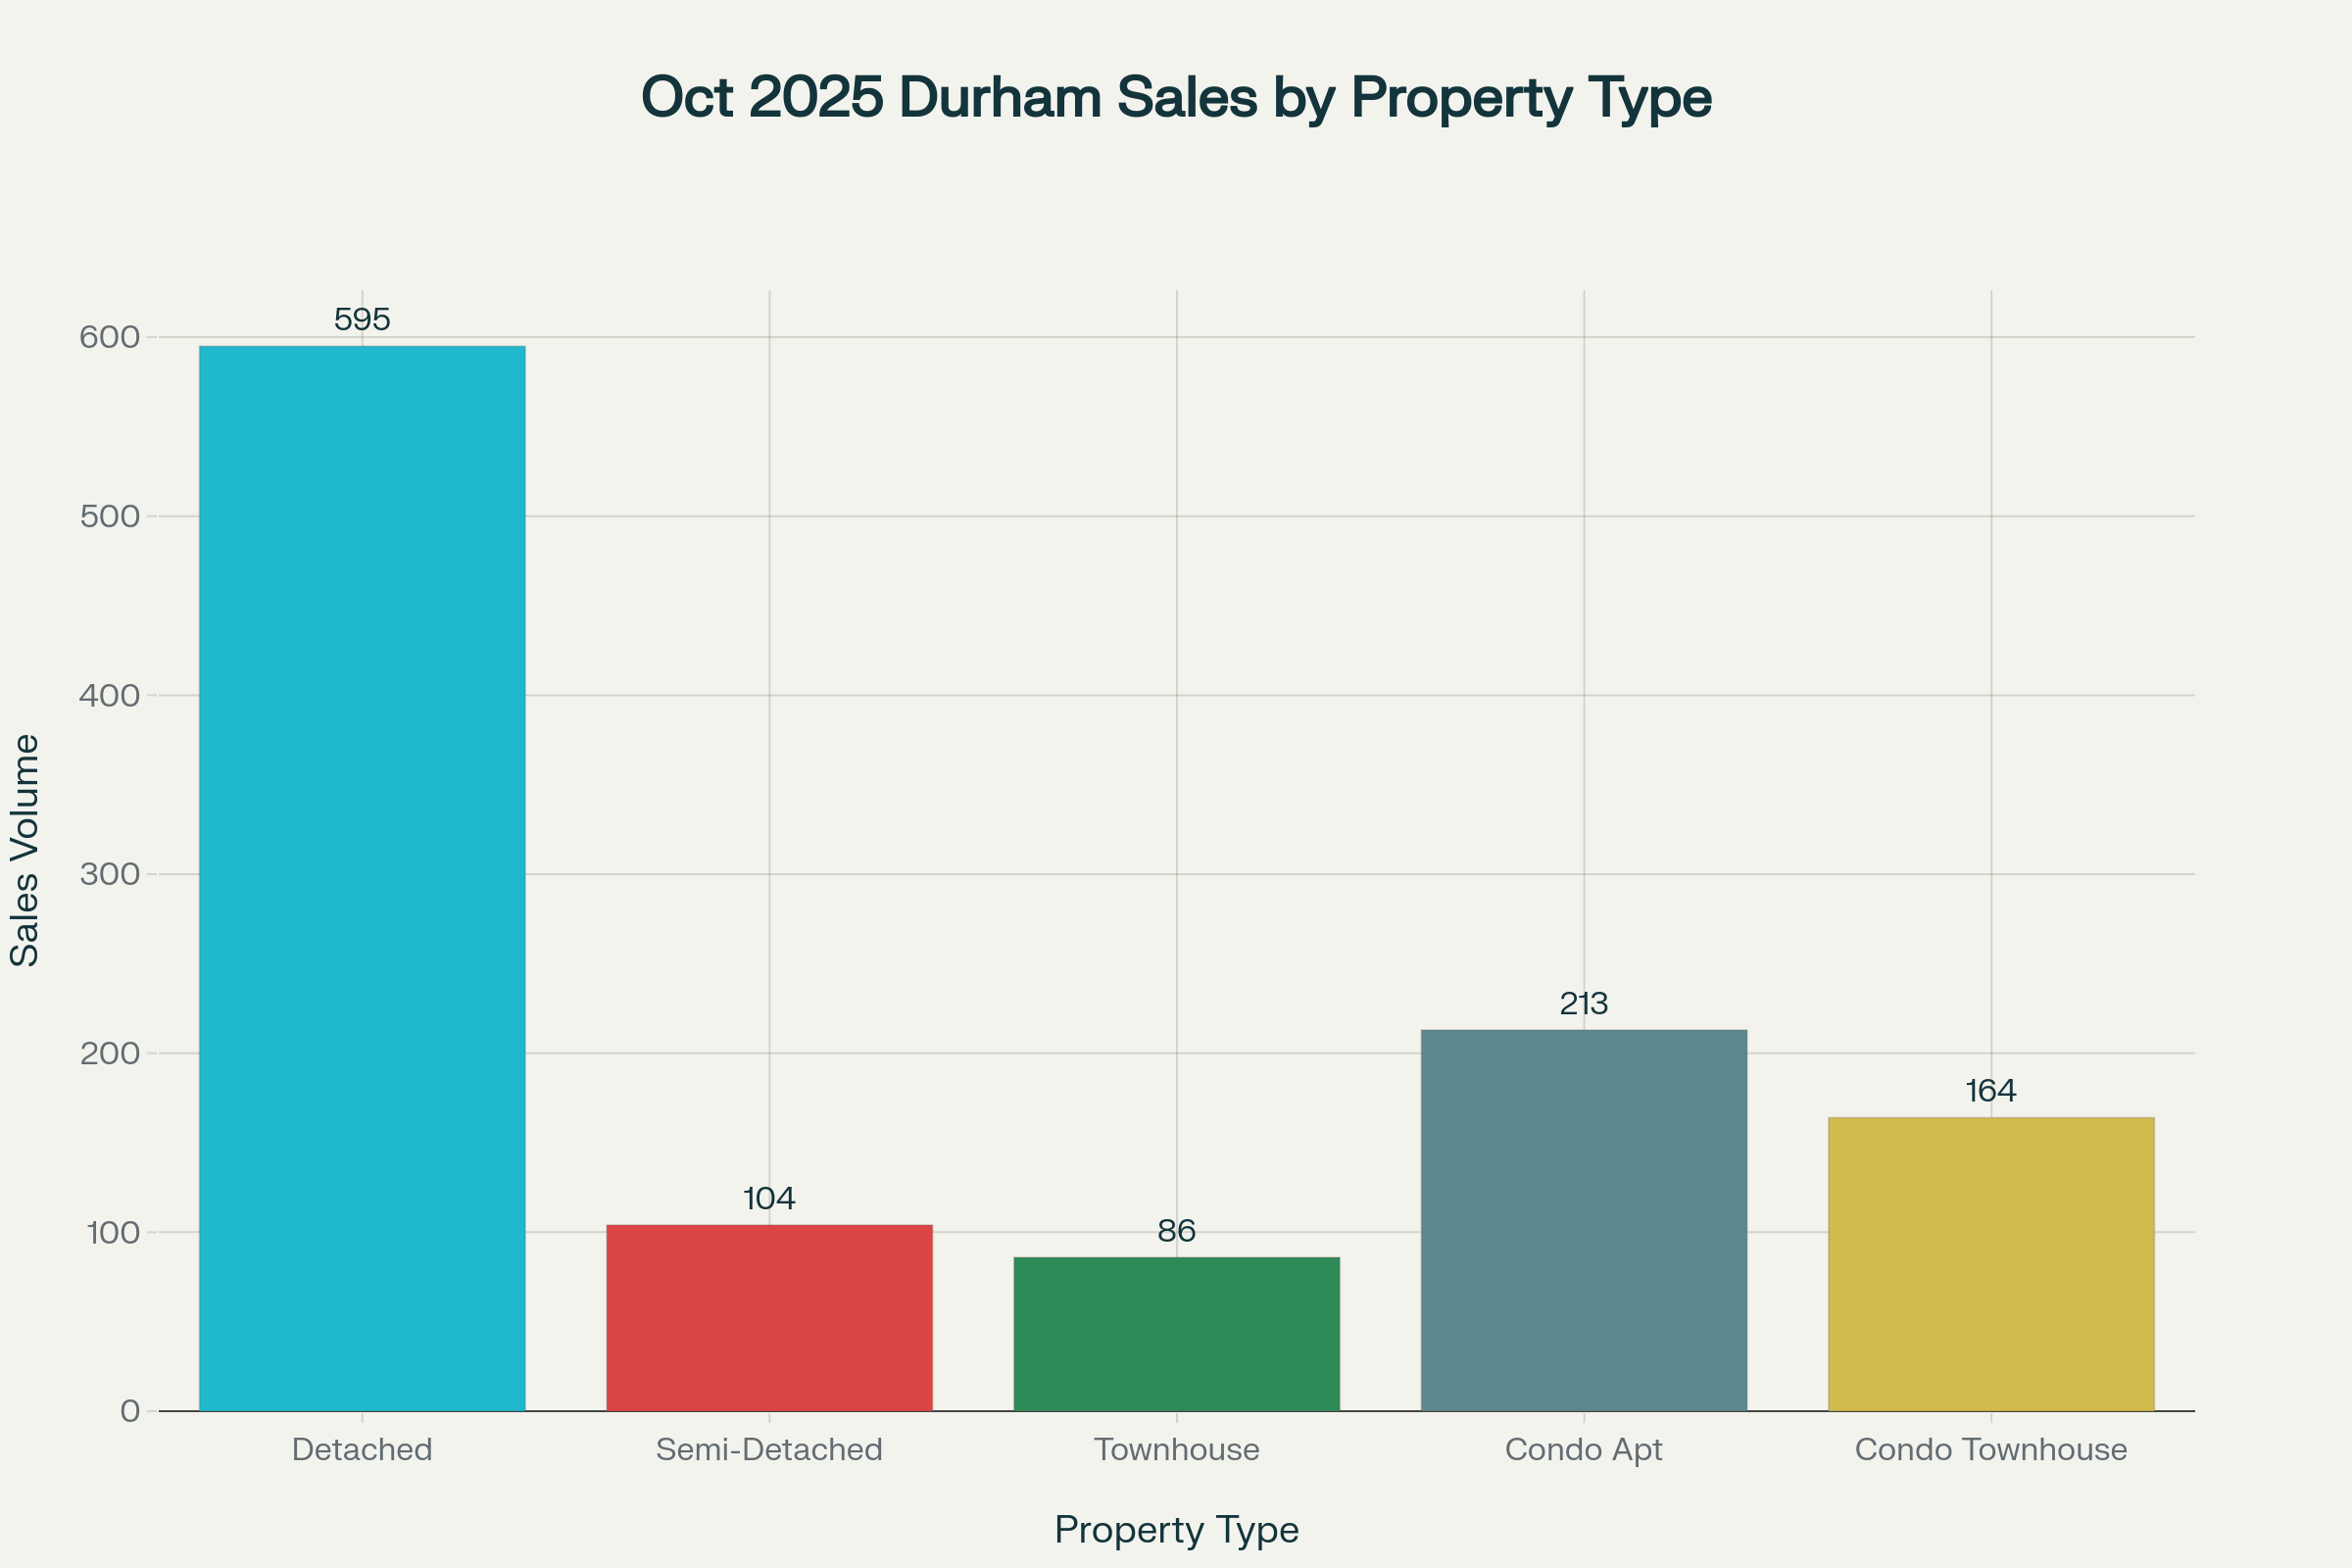
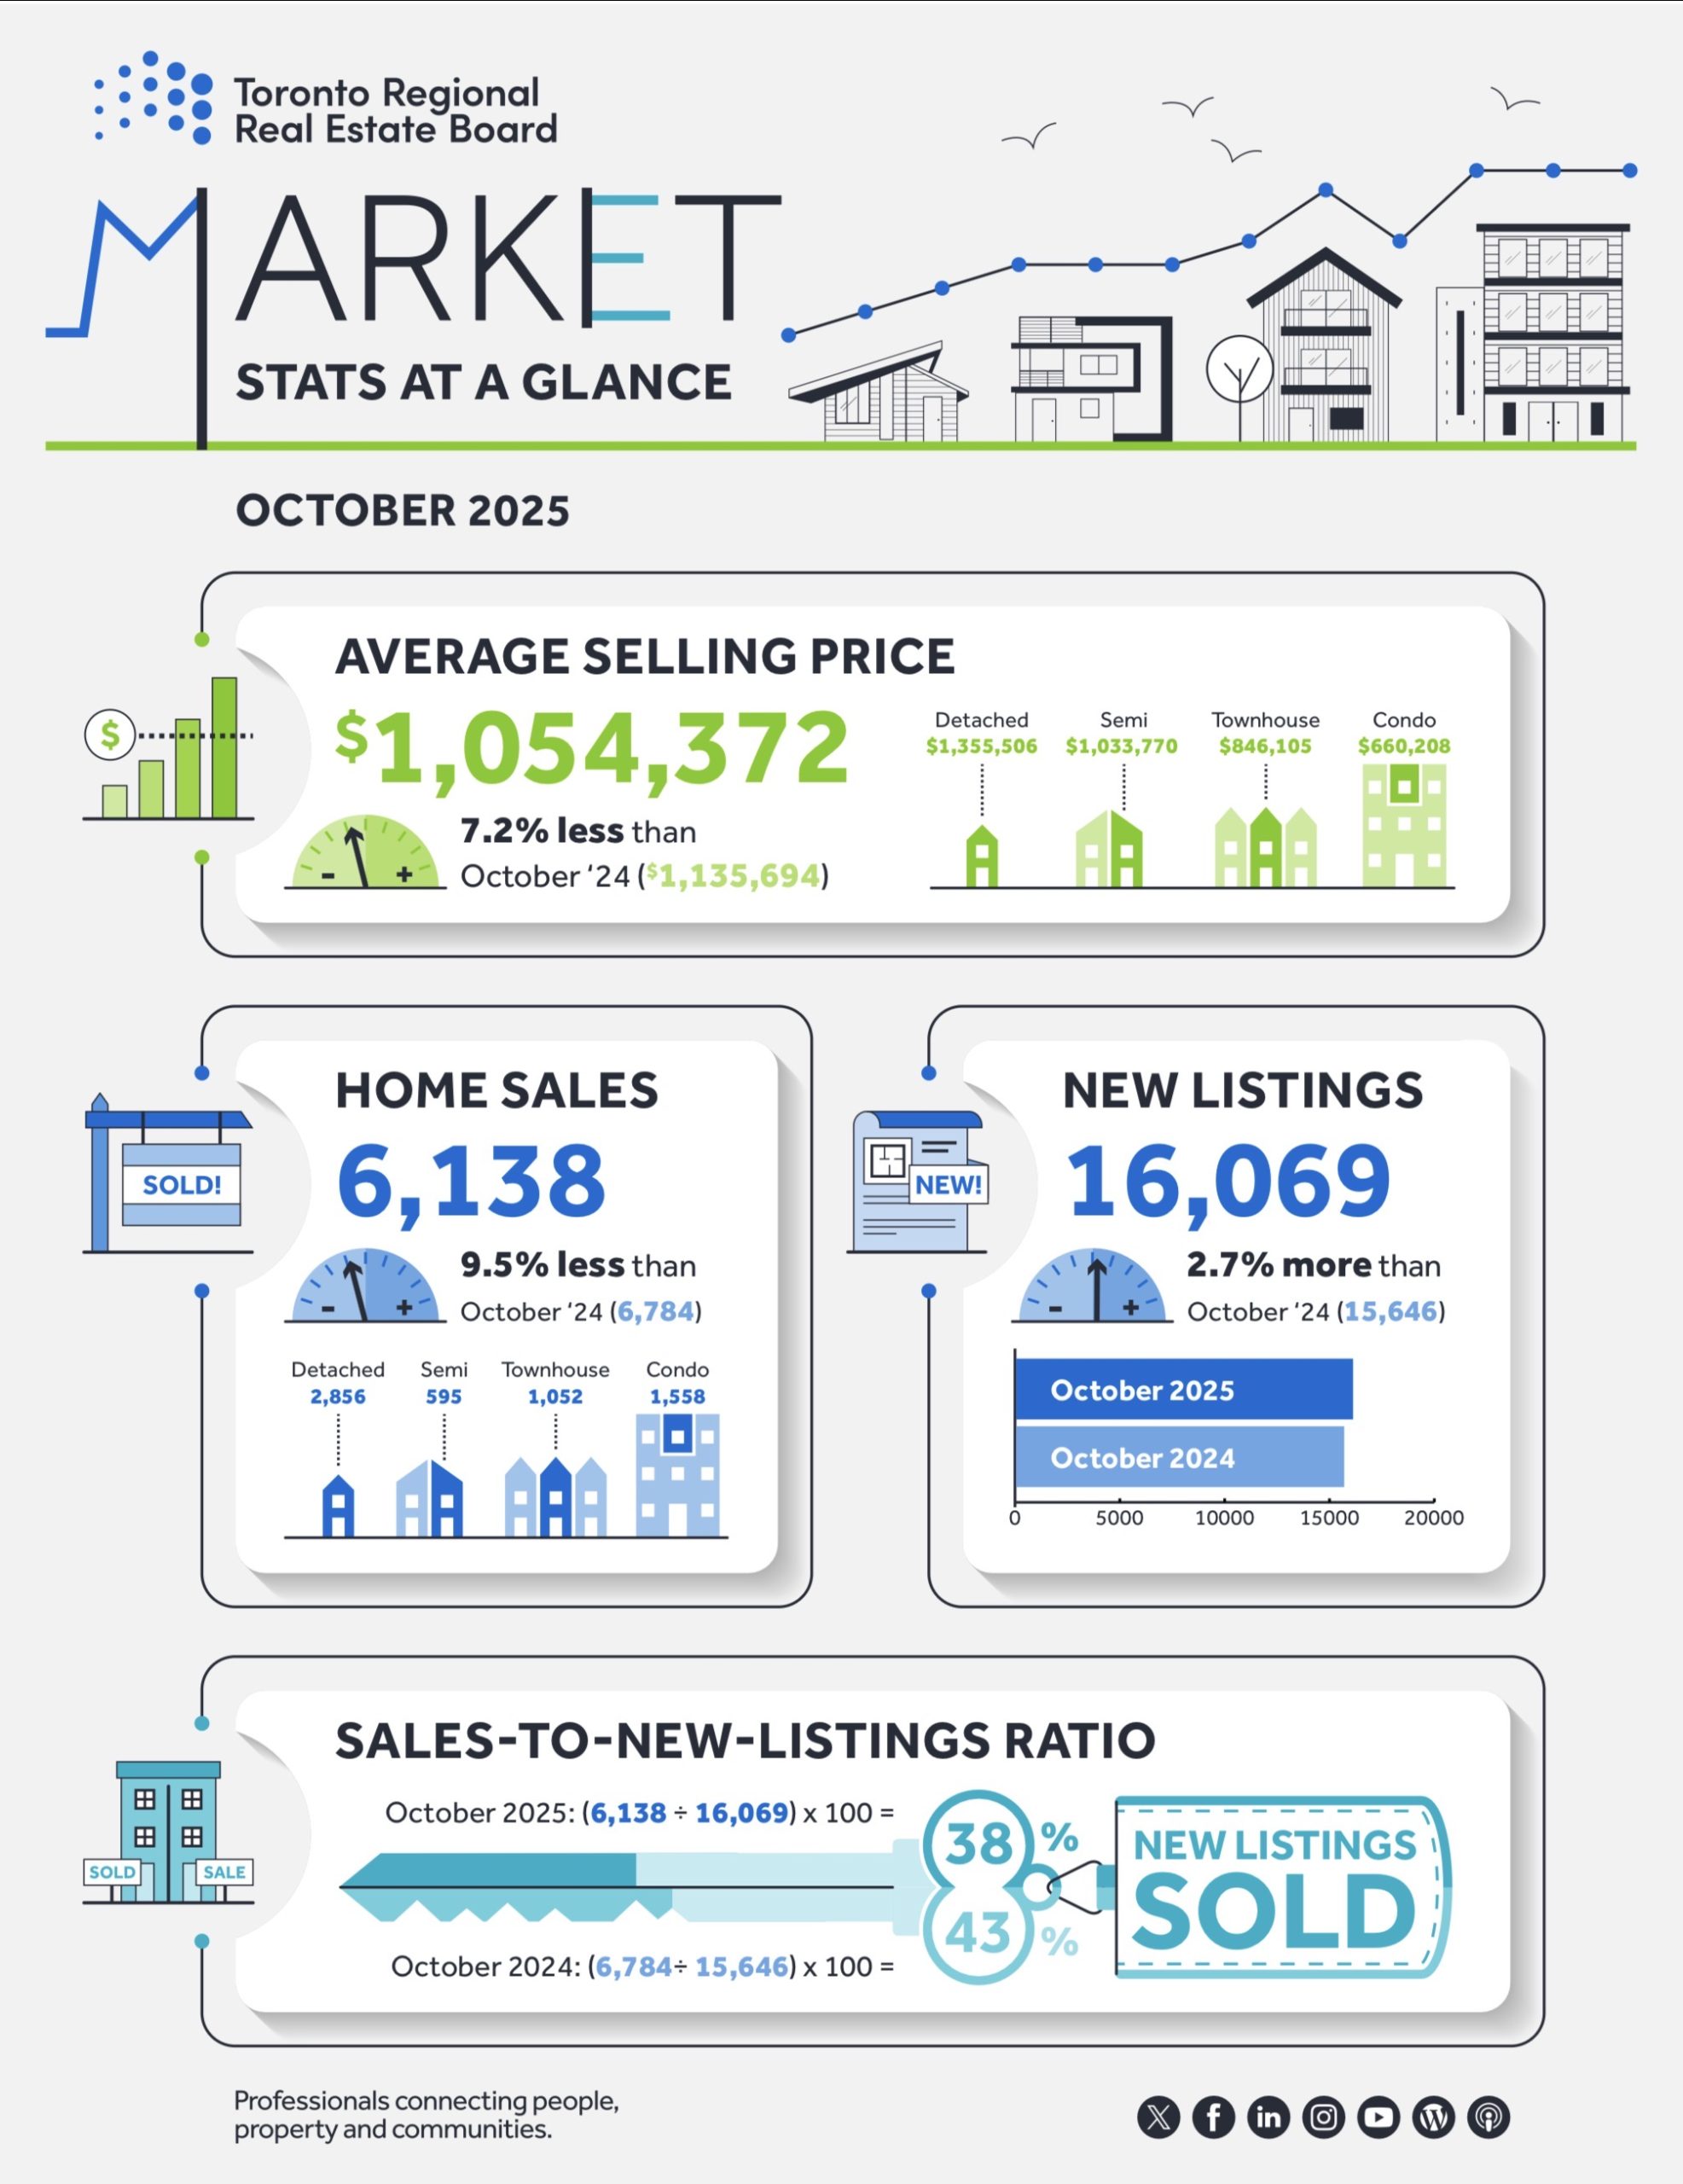


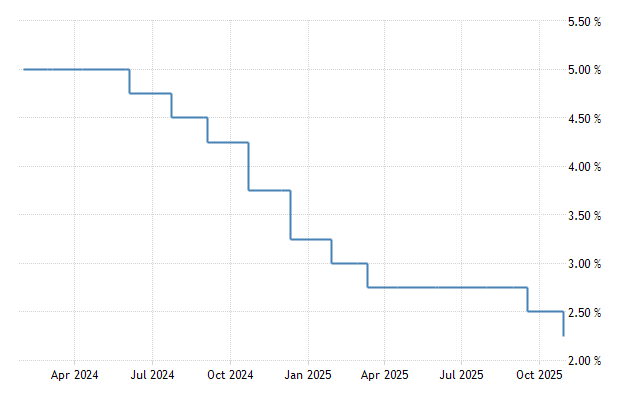

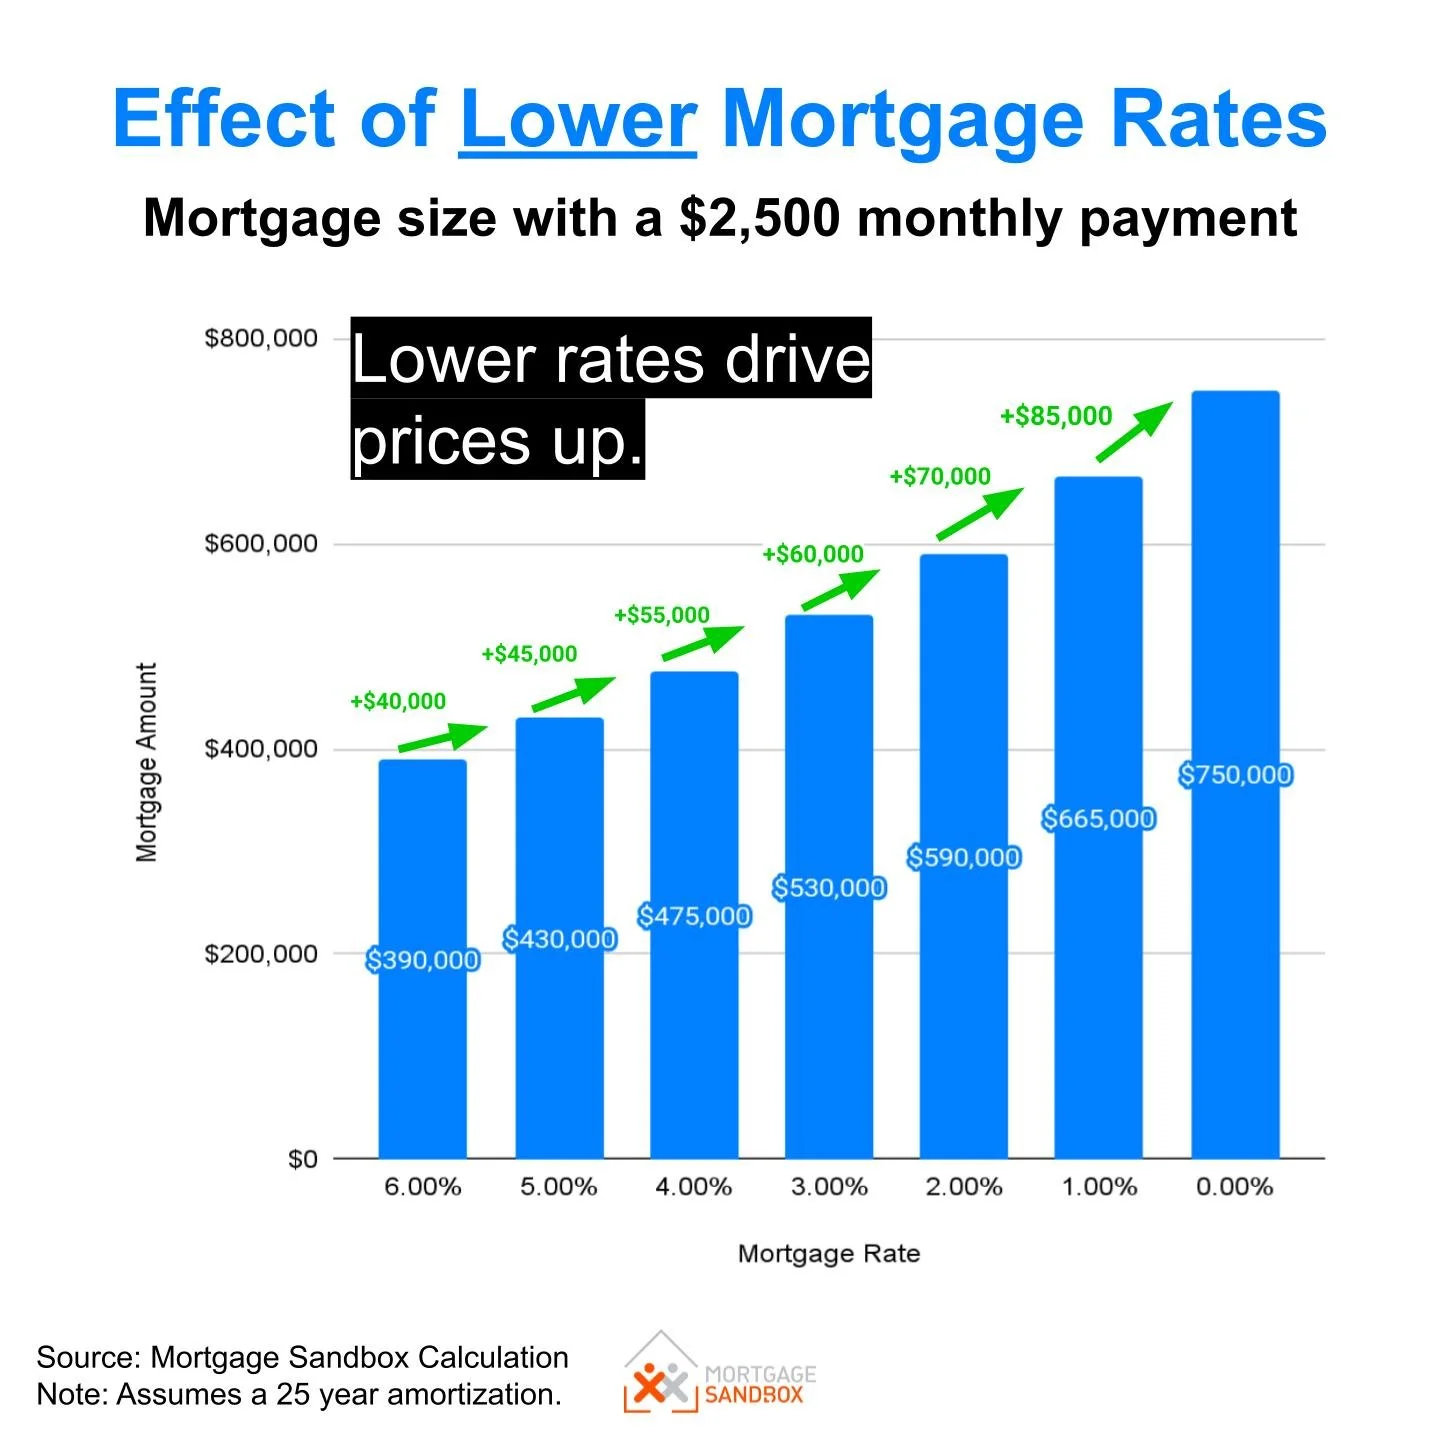

 Bank of Canada Rate Cut + GTA Market Snapshot


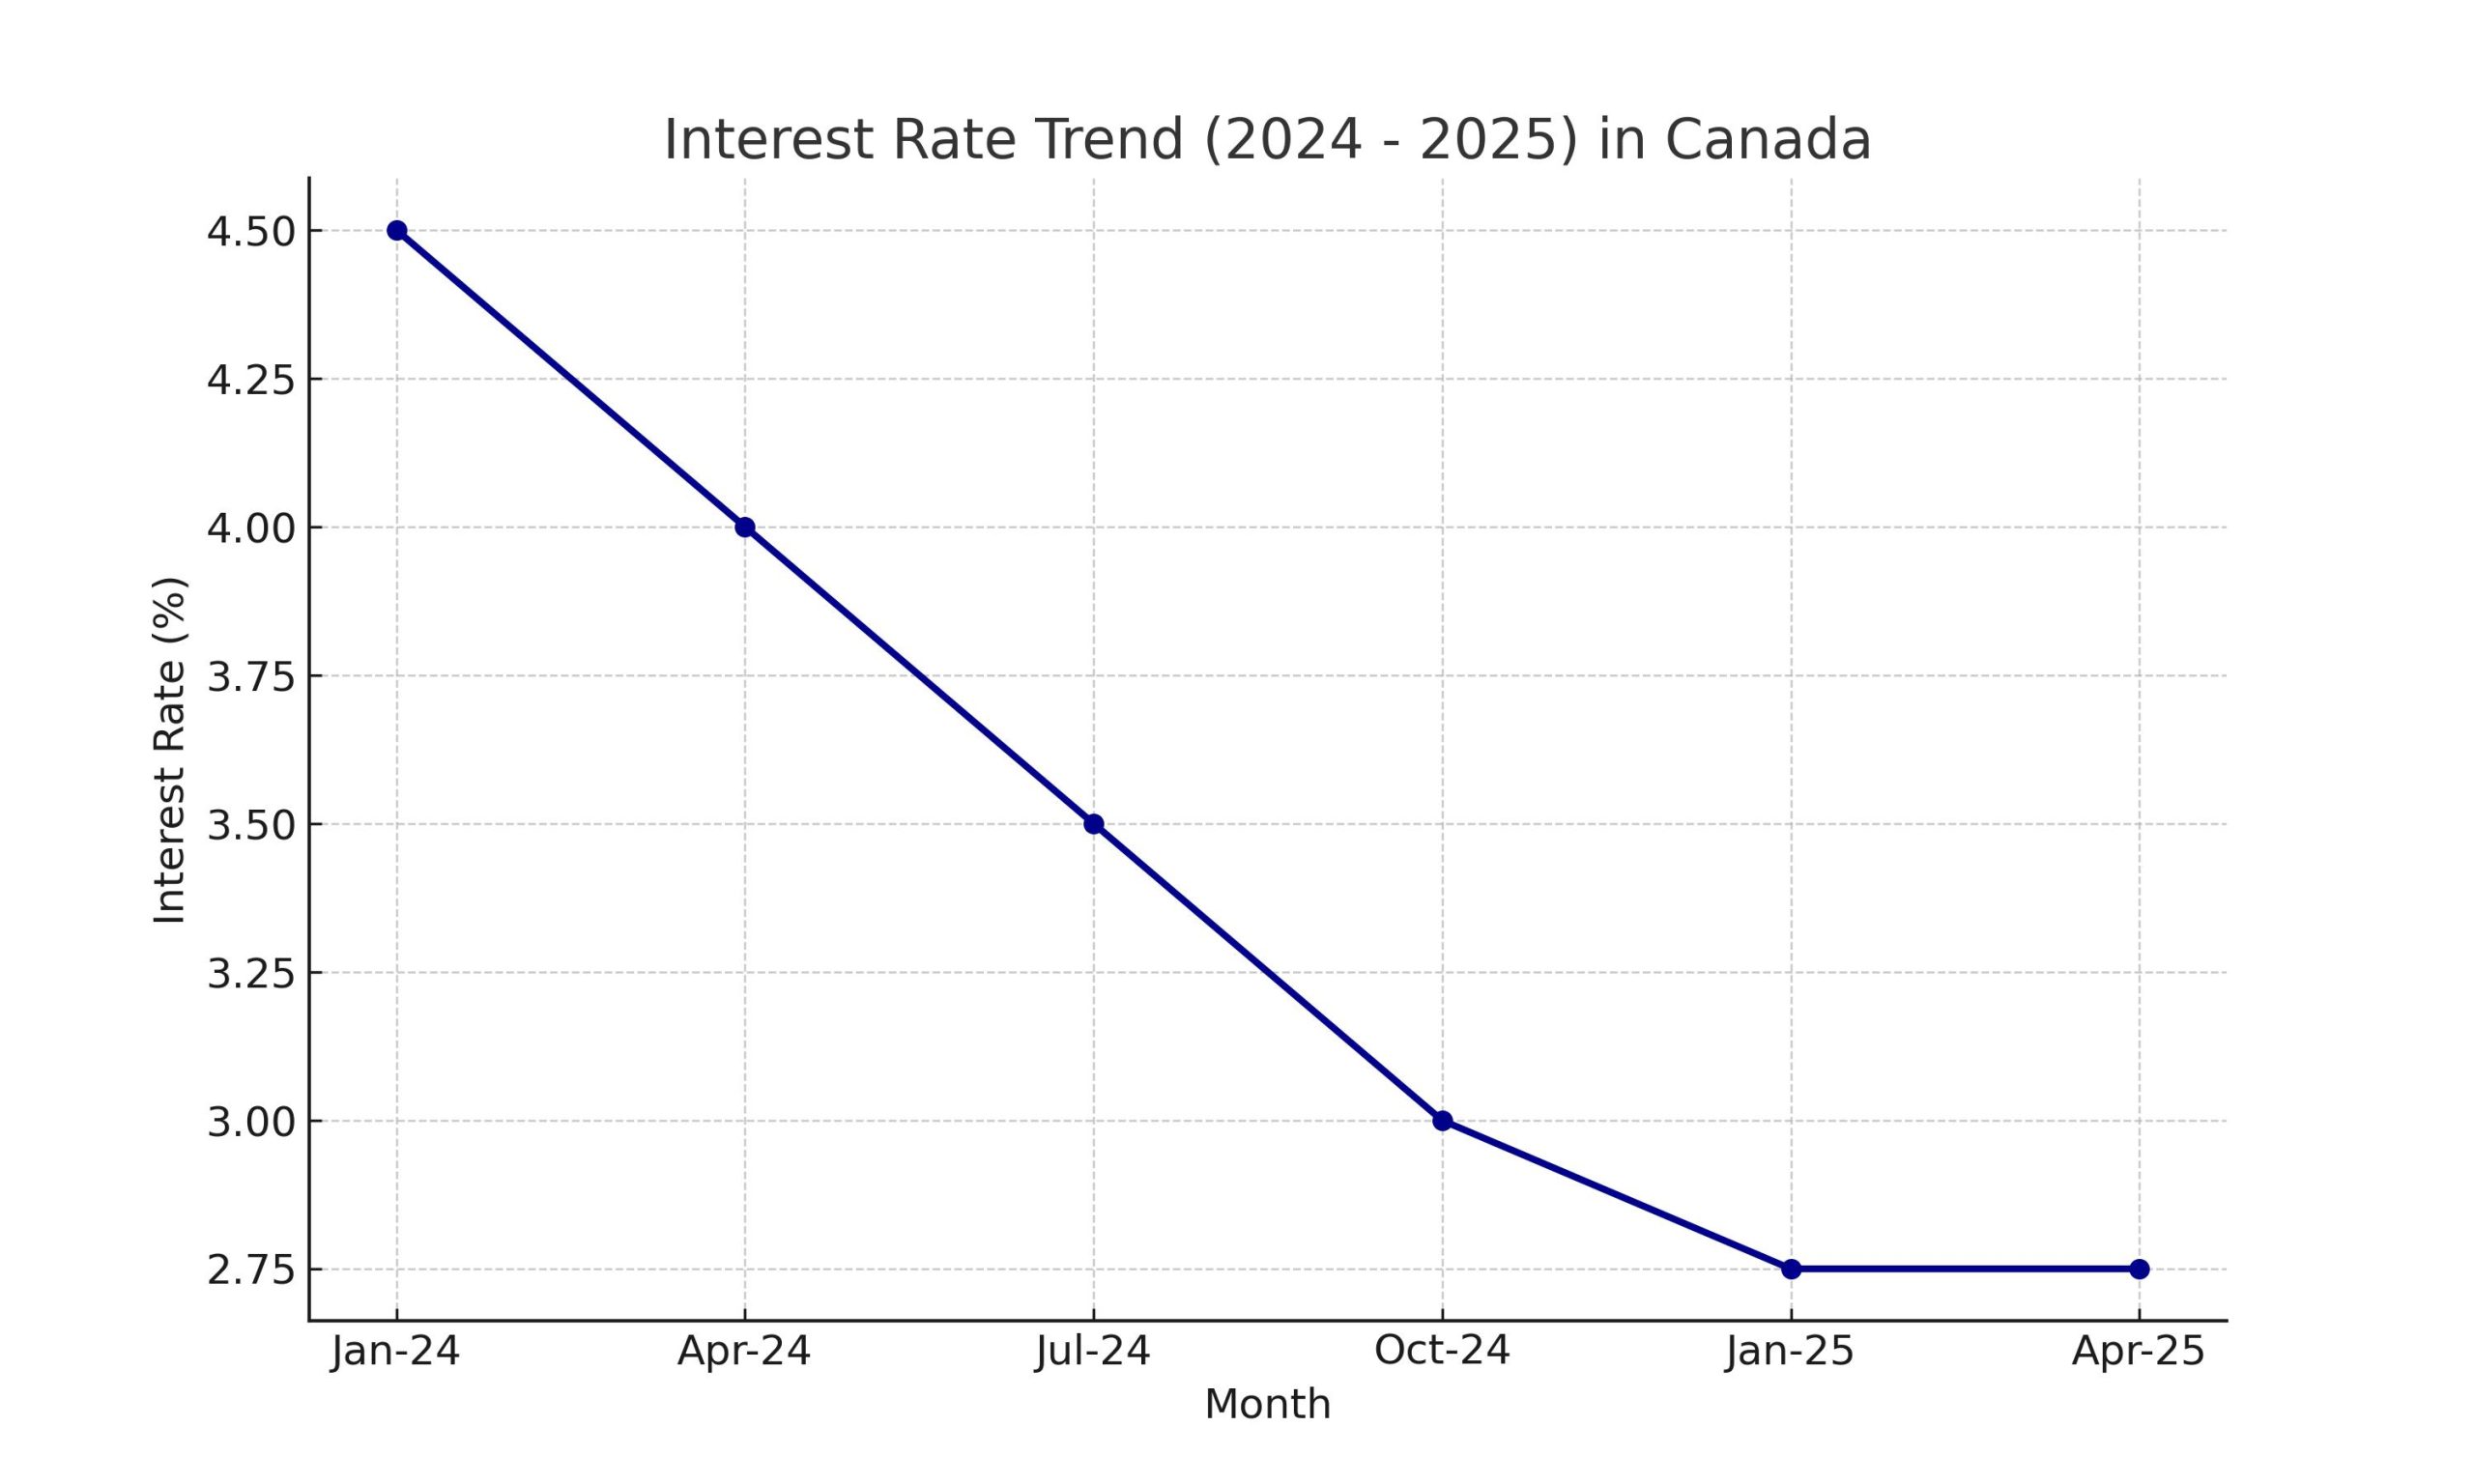
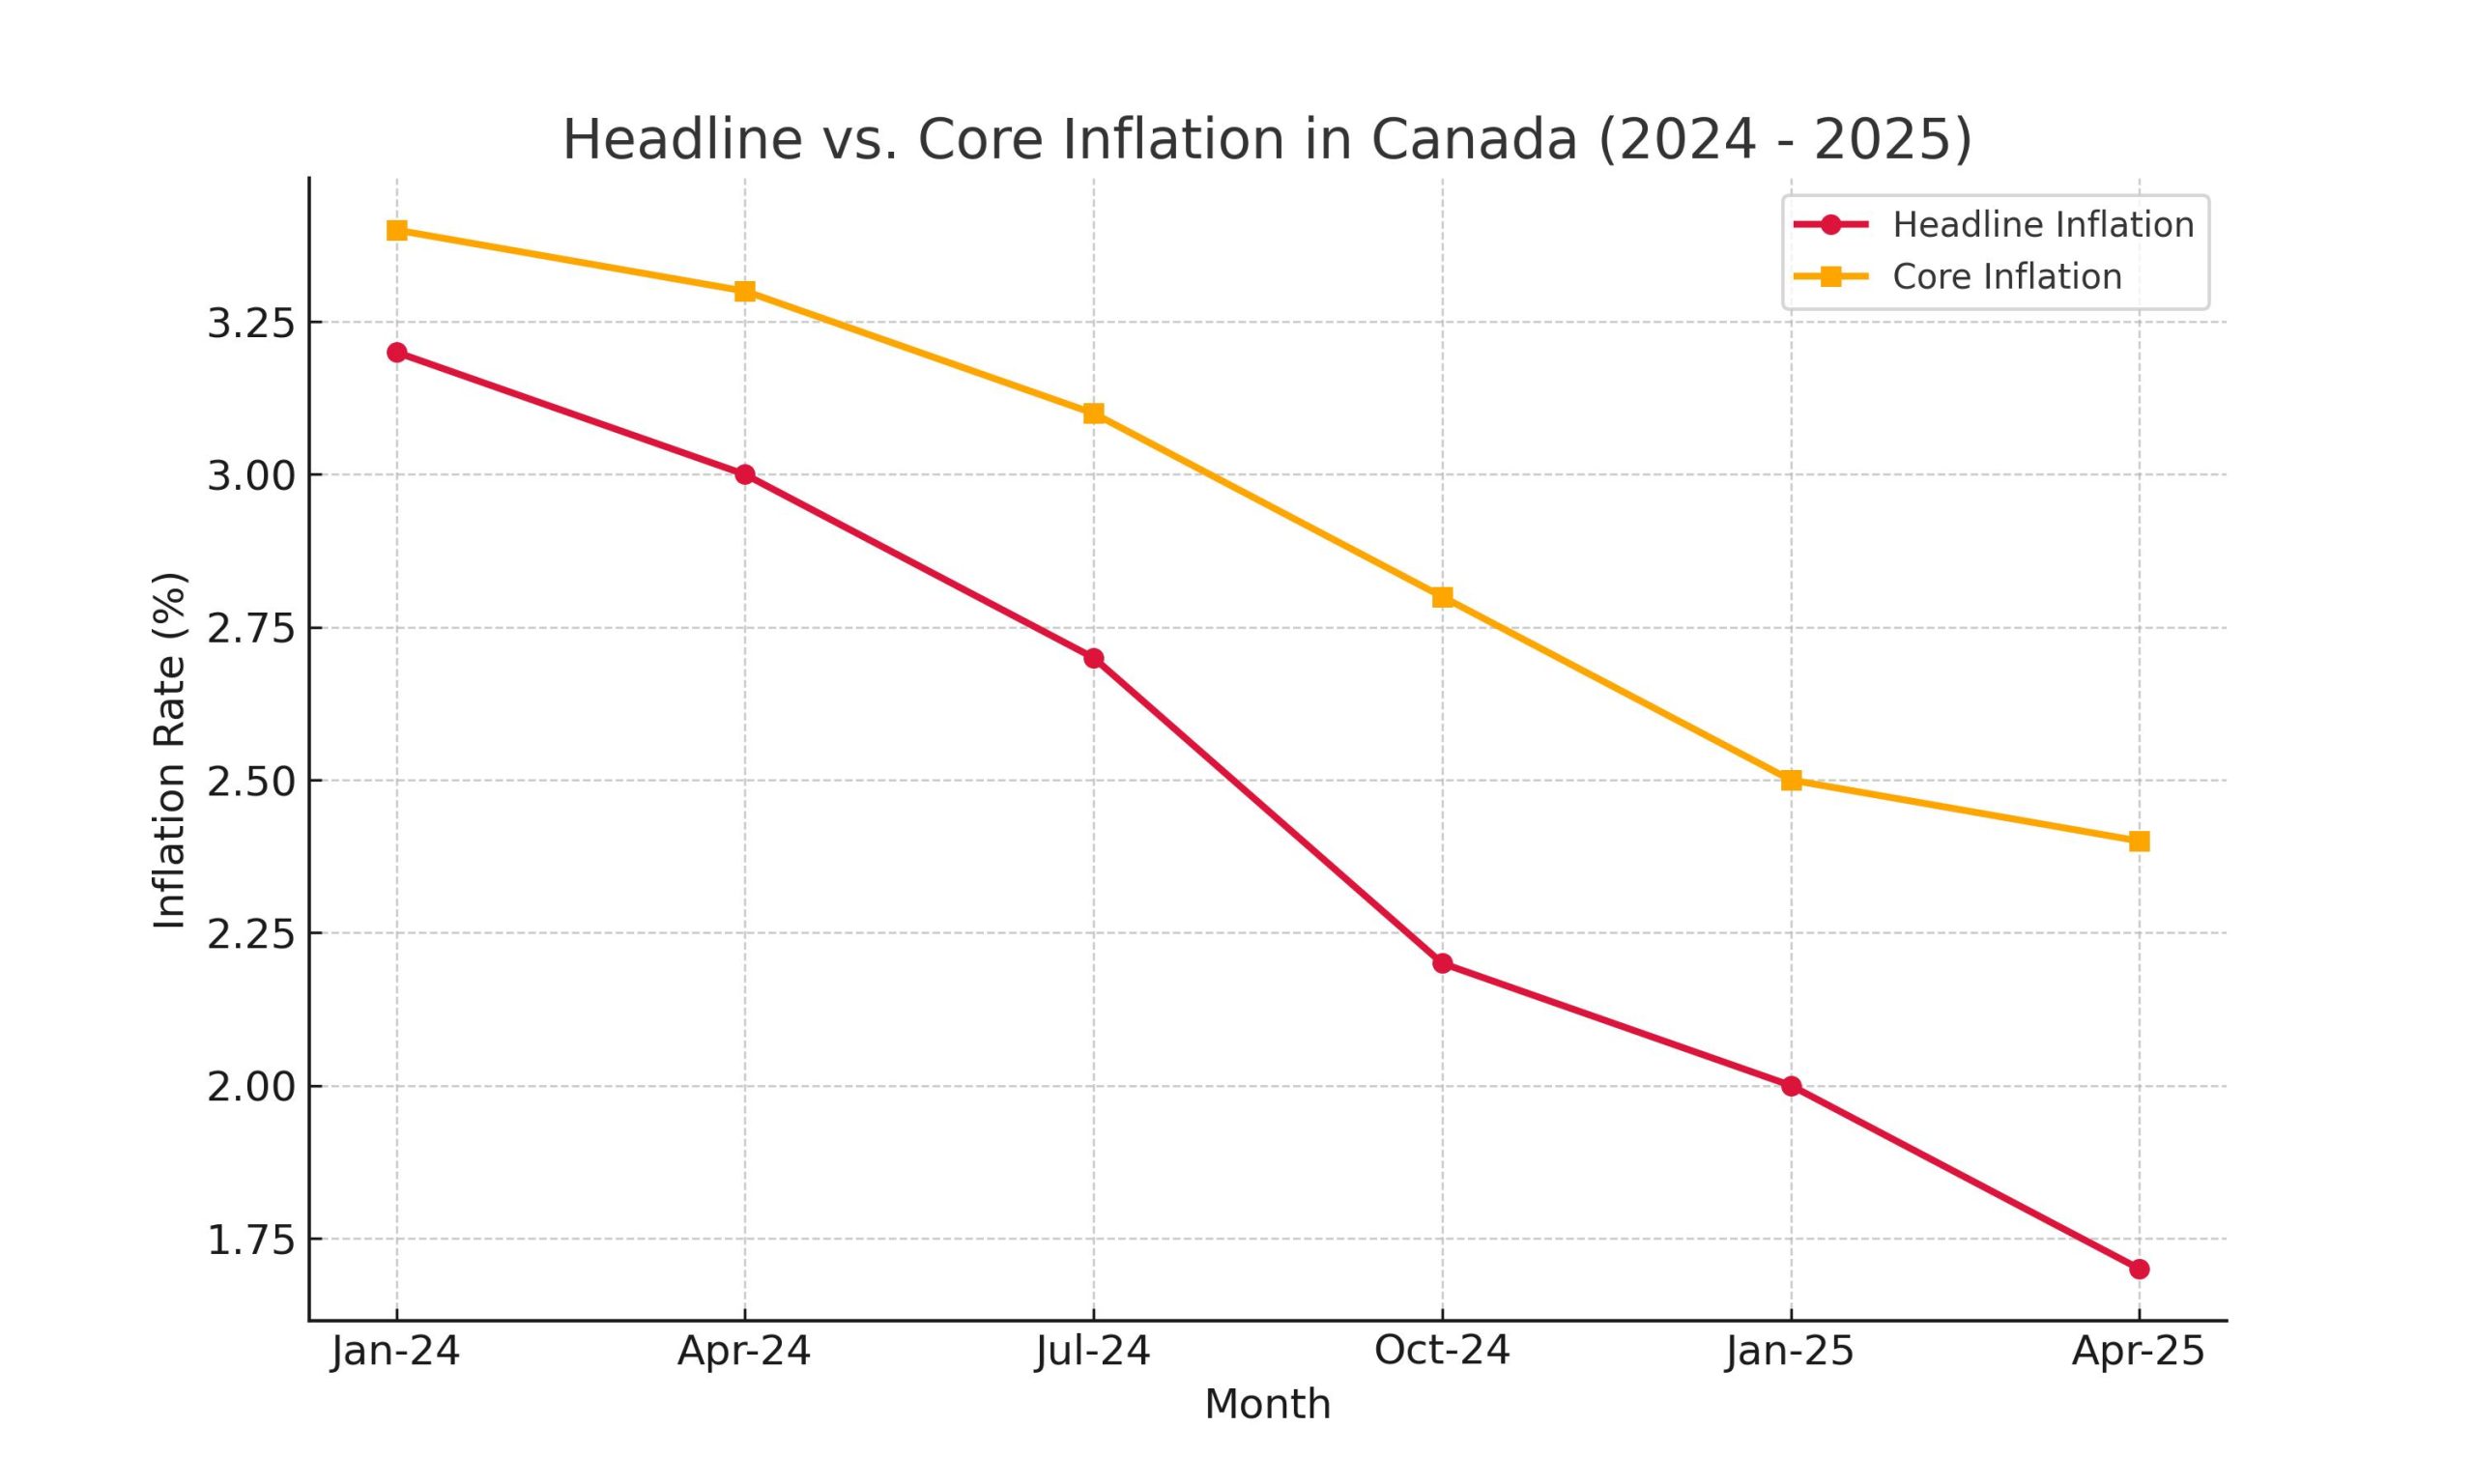
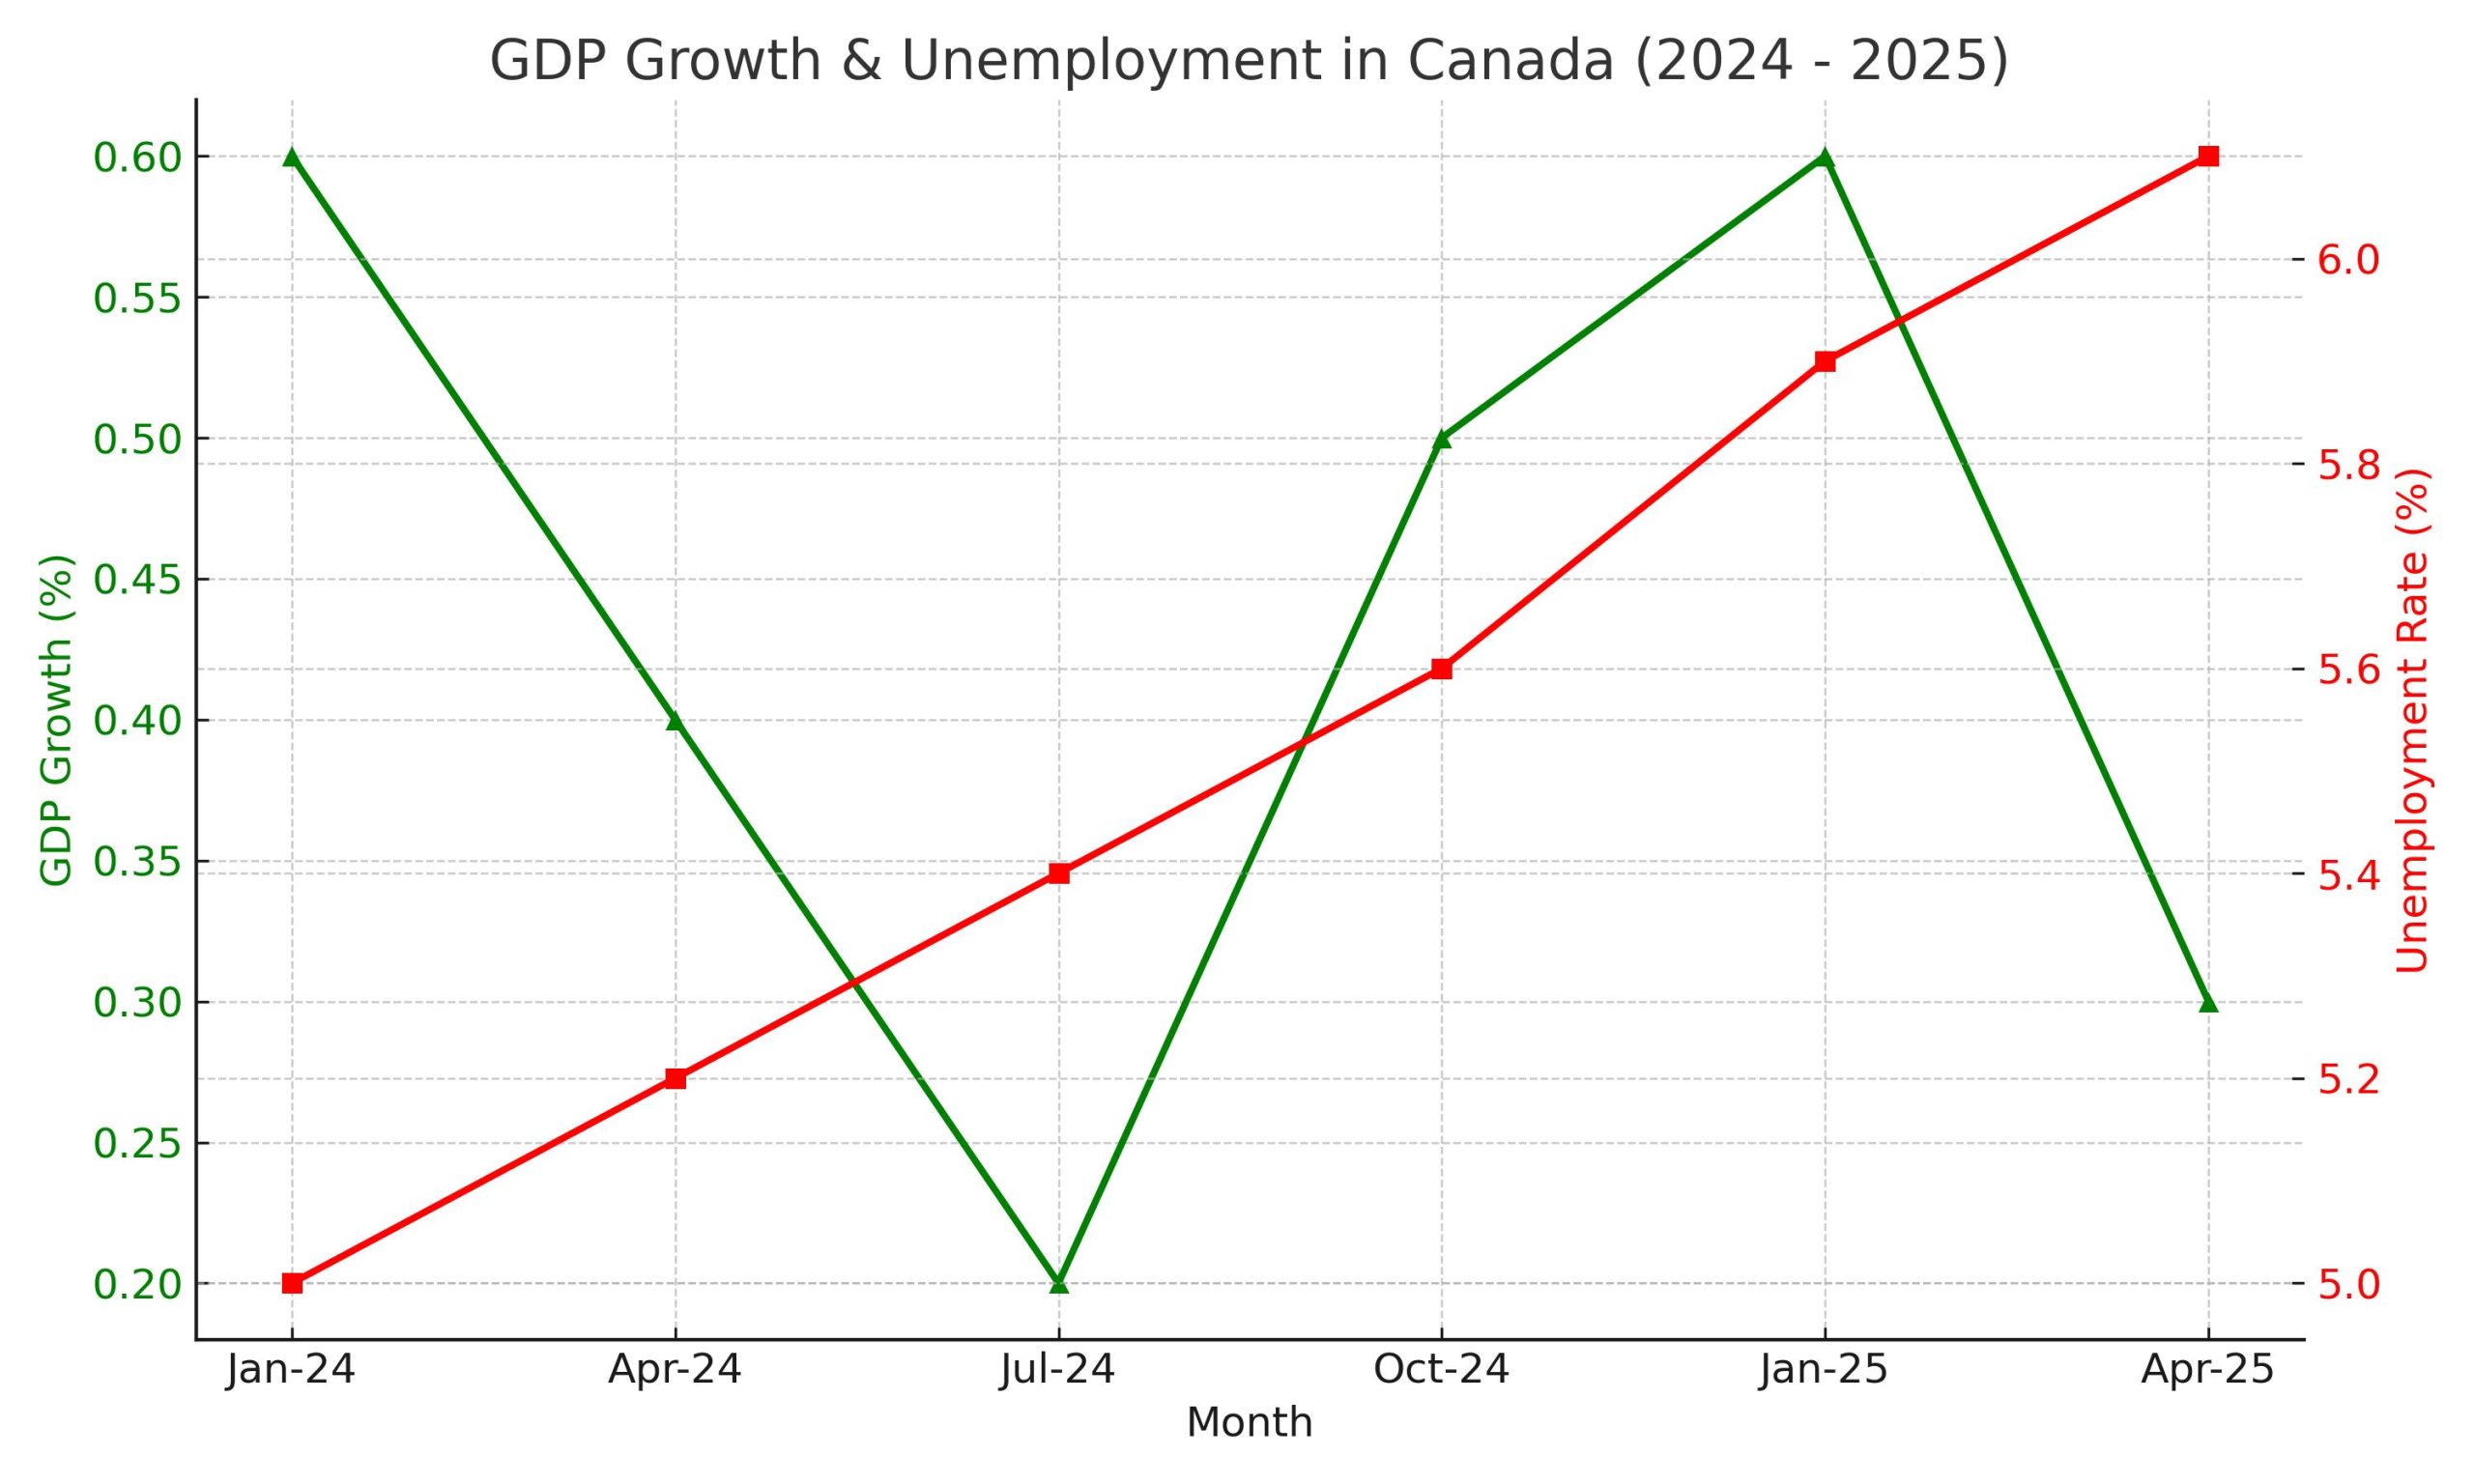

 Key Highlights for April 2025:
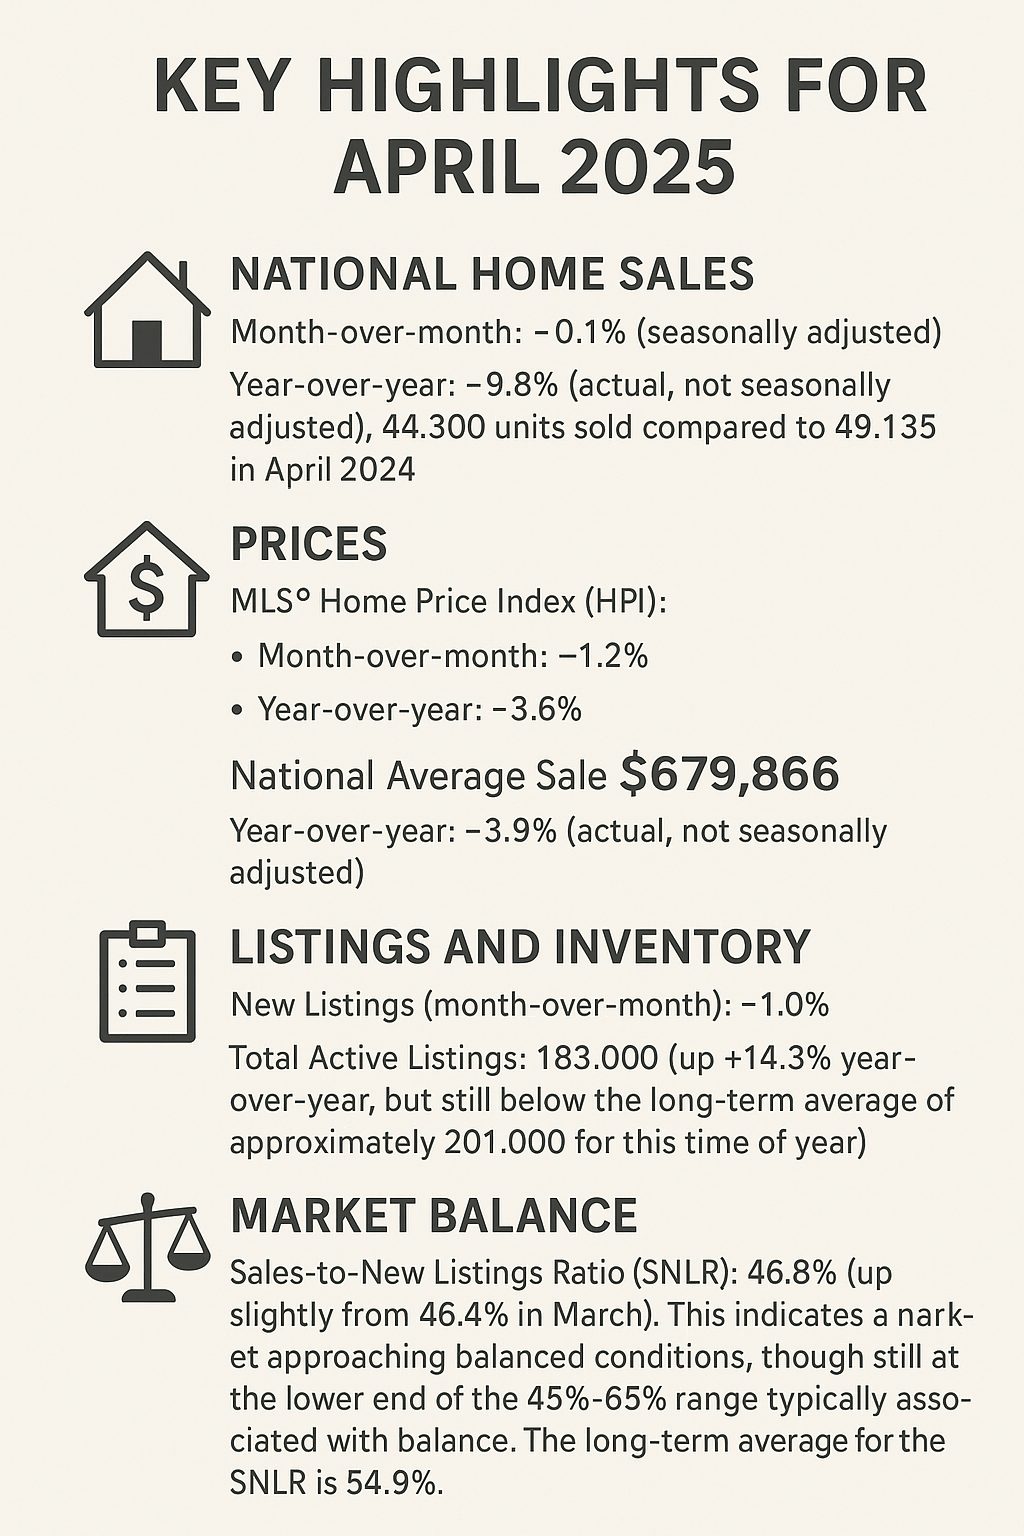

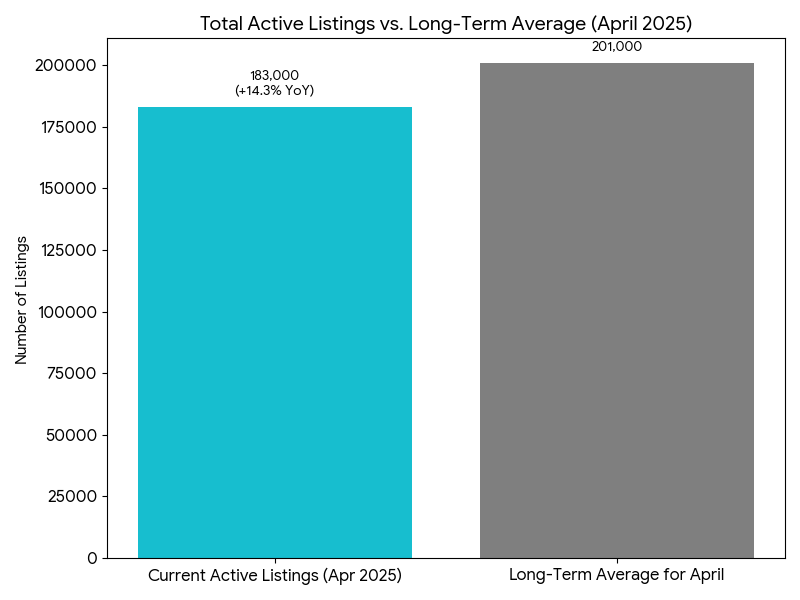 This chart compares the total number of homes available for sale at the end of April 2025 (183,000, up 14.3% year-over-year) against the typical long-term average for that time of year (approximately 201,000). It shows that while listings have increased from last year, they still haven’t reached the historical average for April. Sales-to-New Listings Ratio (SNLR) – April 2025 This chart shows the SNLR for April 2025, comparing it to the long-term average and the thresholds for different market conditions (buyer’s, balanced, seller’s).
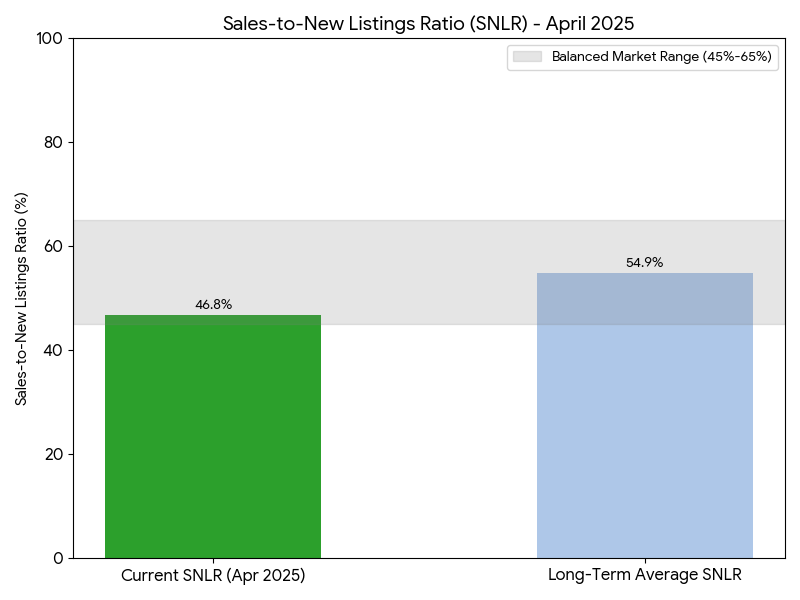
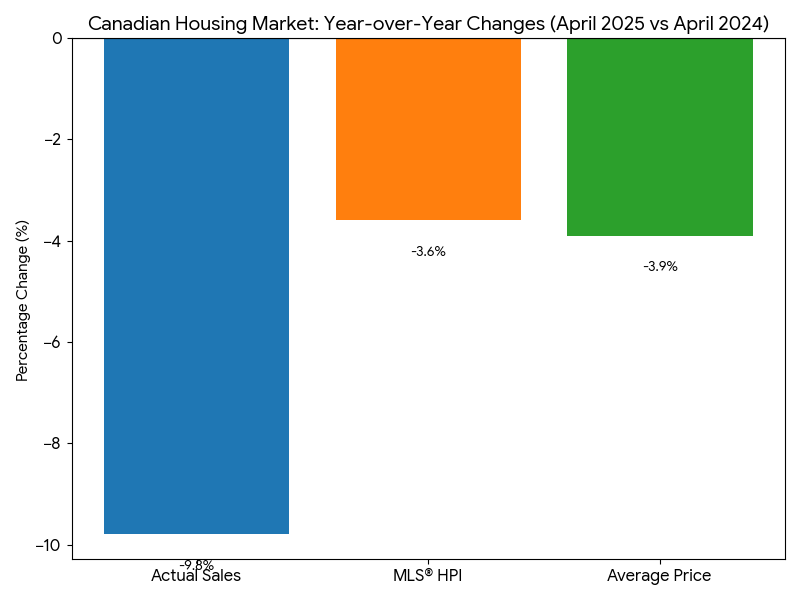 This chart illustrates the percentage change in actual home sales, the MLS® Home Price Index, and the national average sale price compared to April of the previous year. All key metrics show a decline, highlighting the cooling trend. Canadian Housing Market – Month-over-Month Changes (April 2025 vs March 2025)
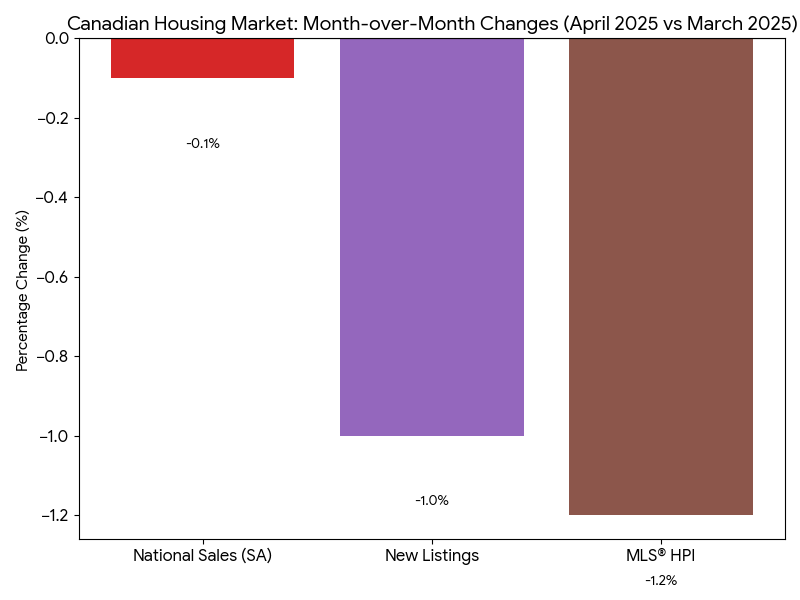


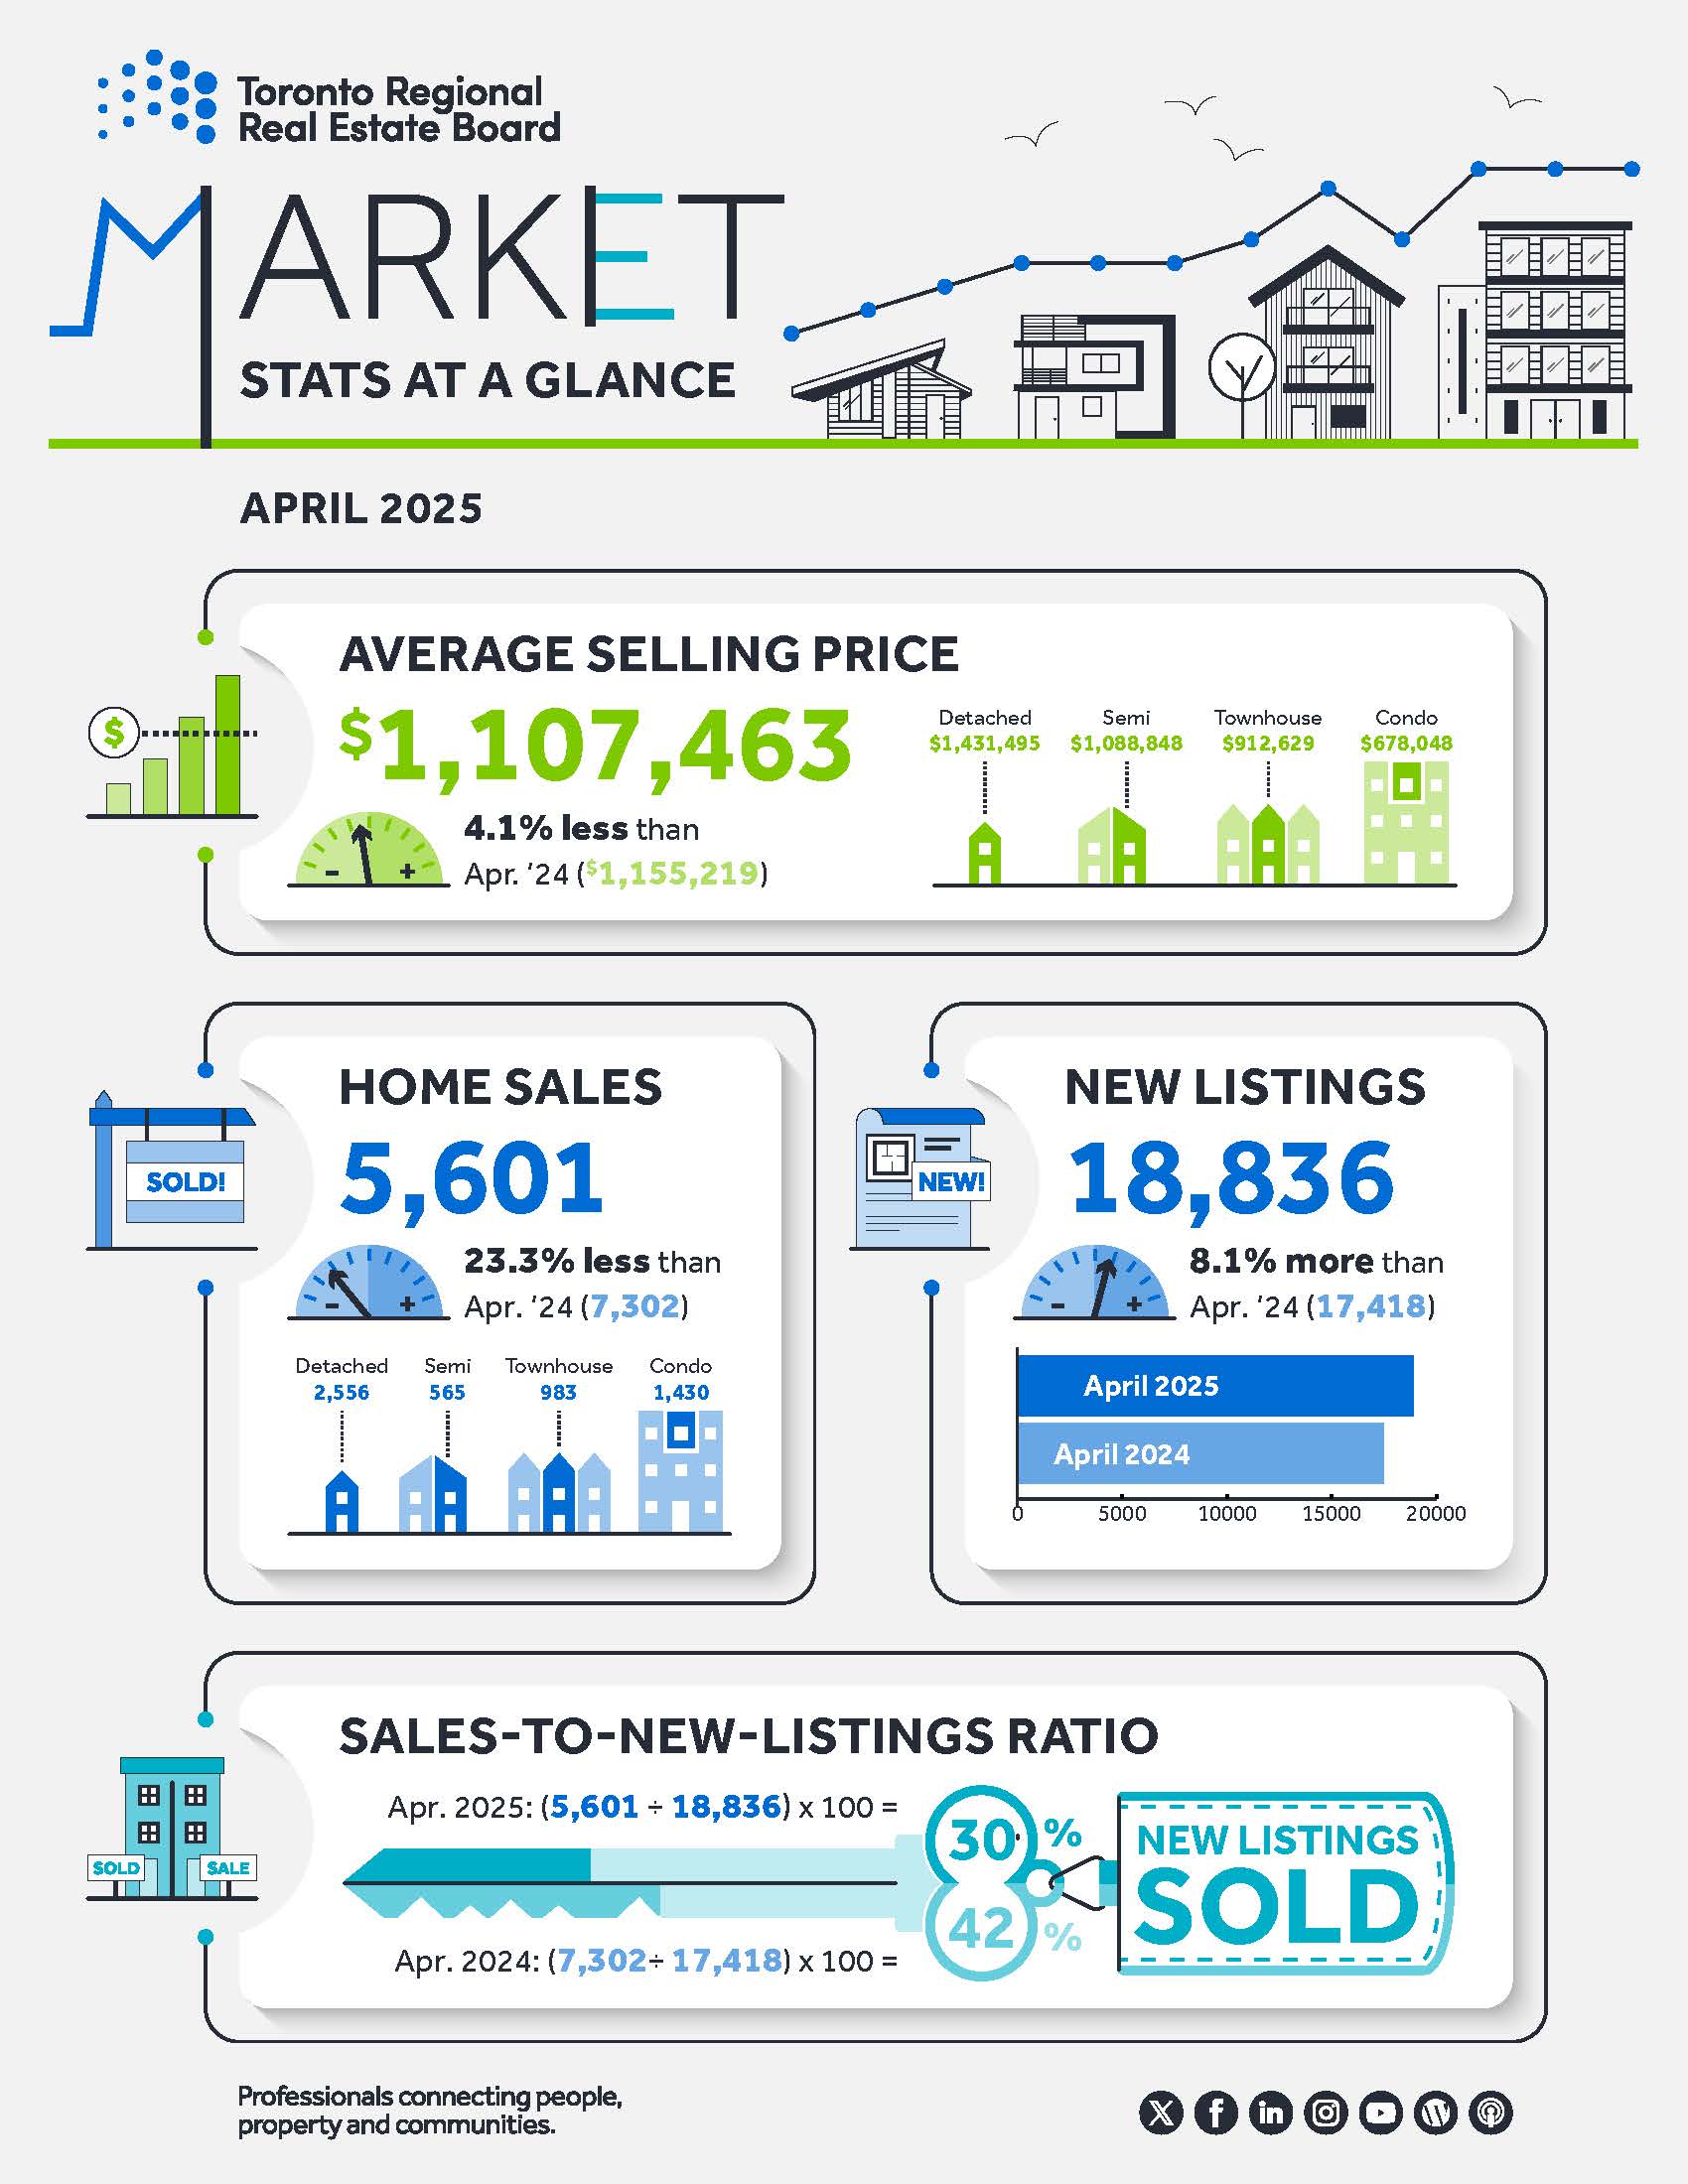
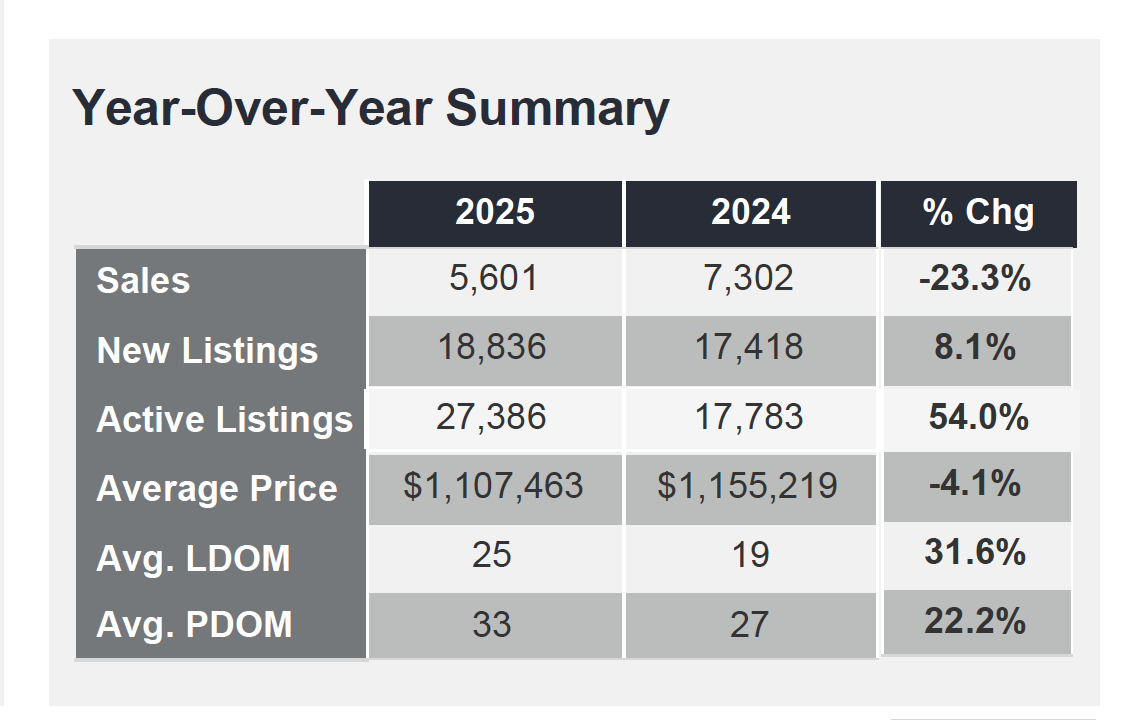
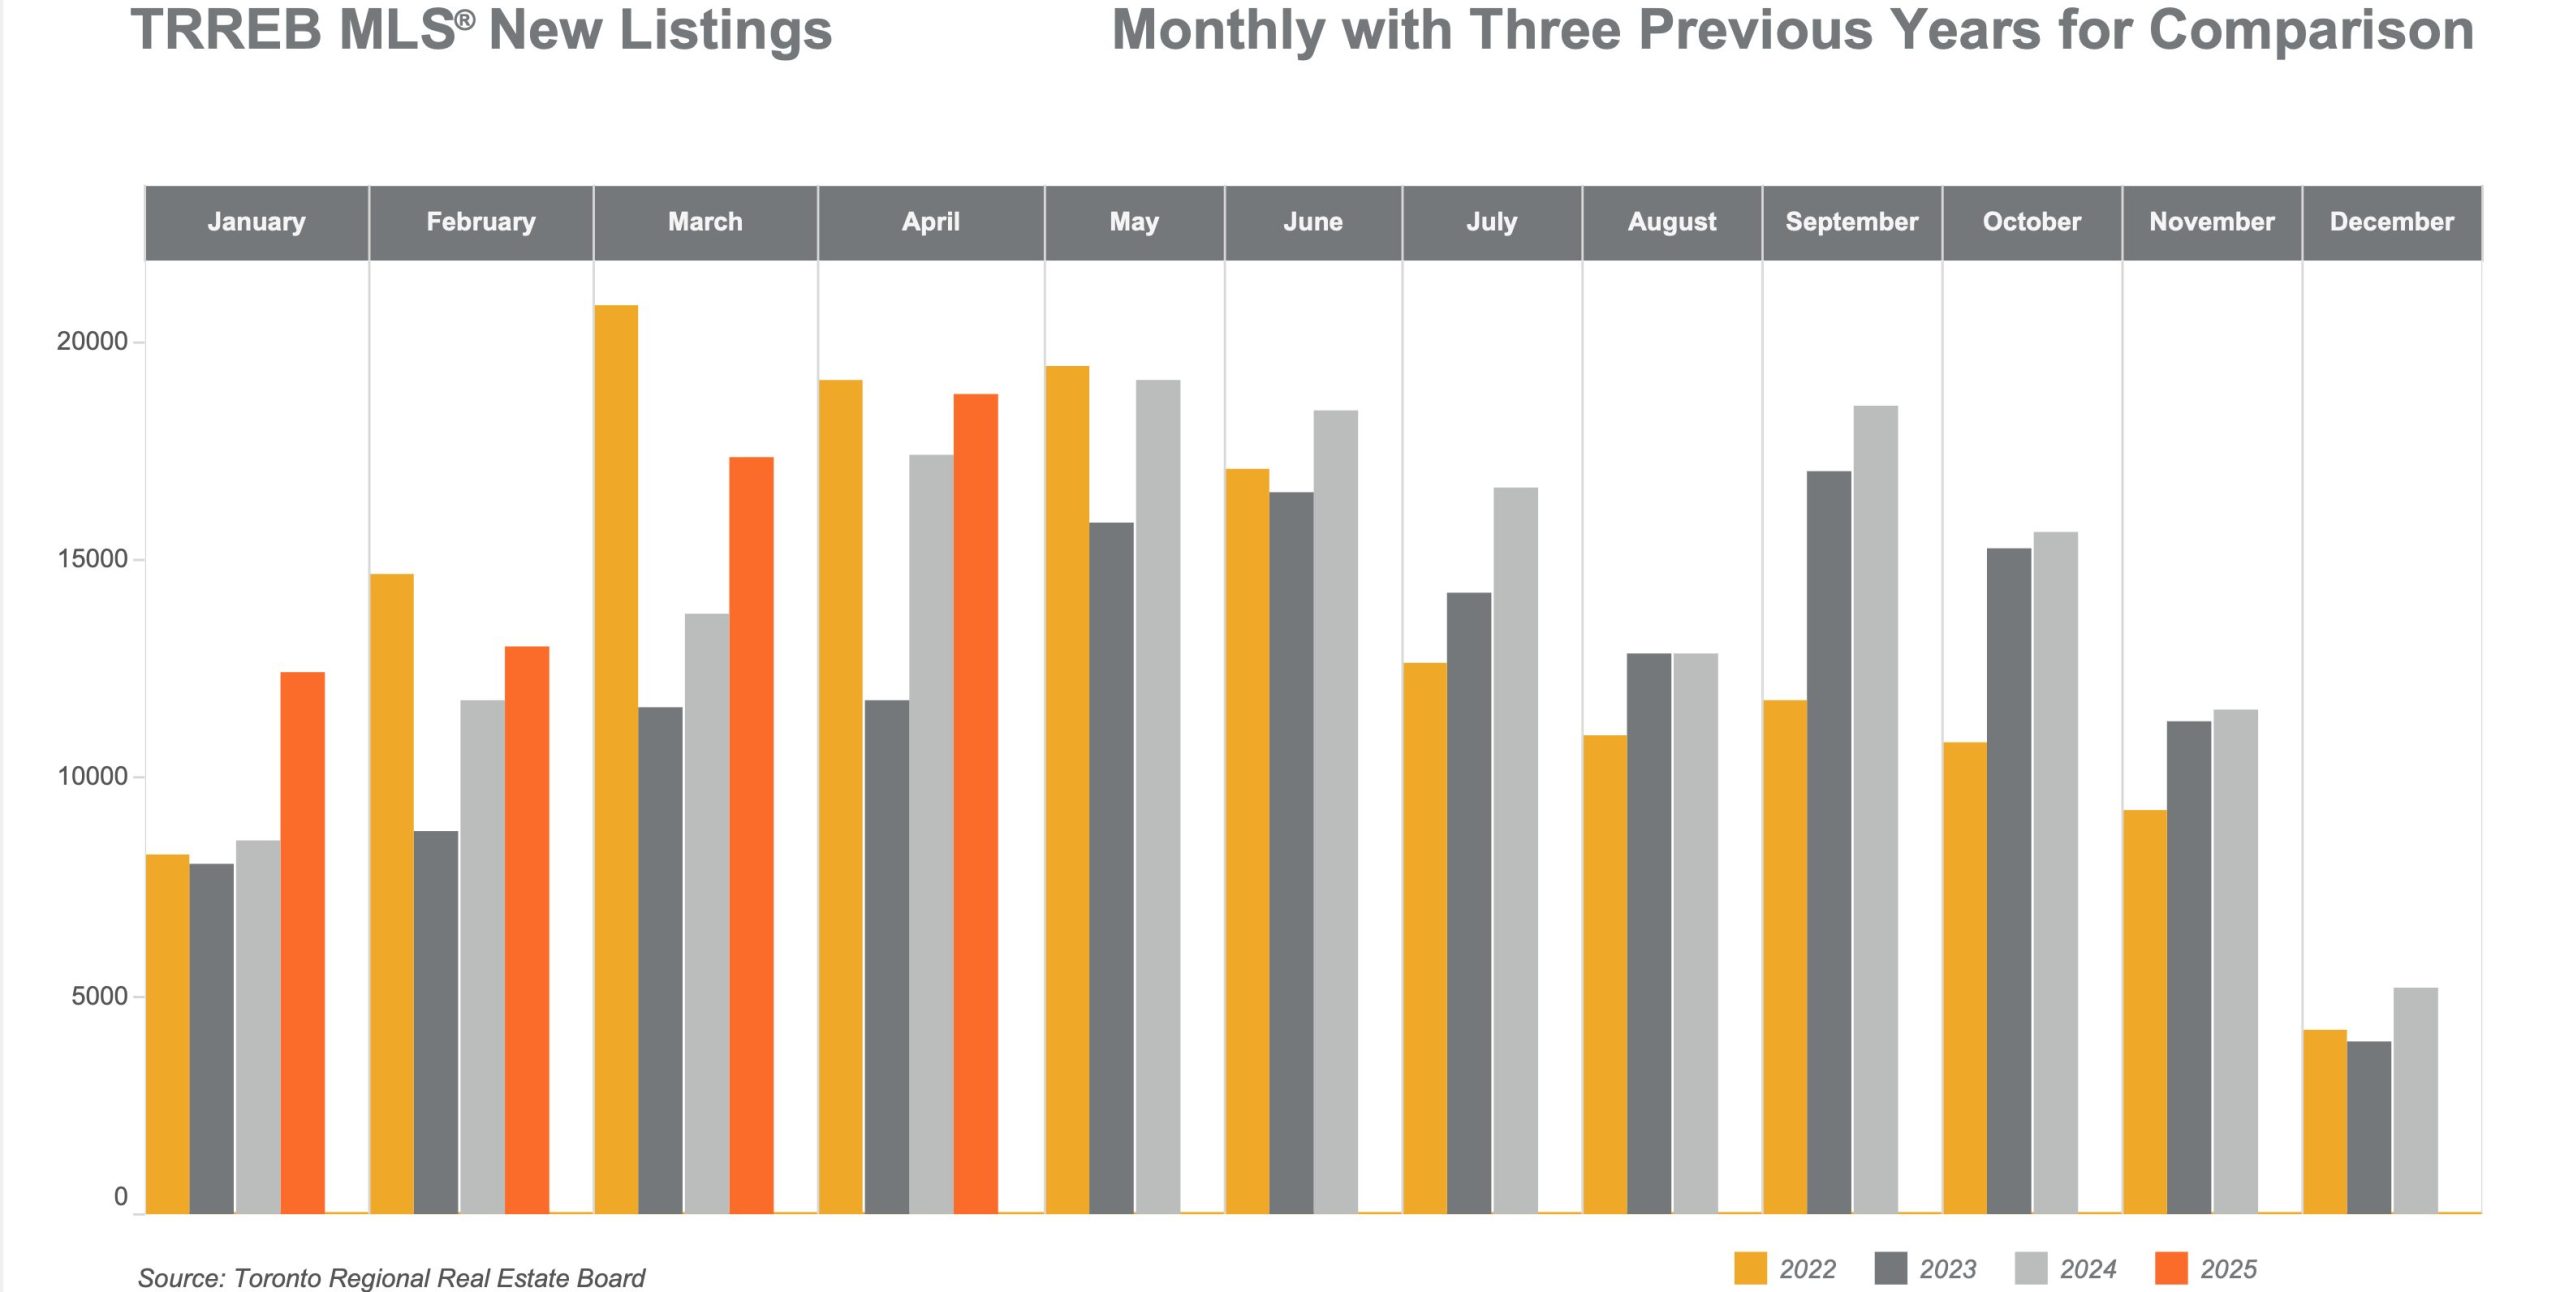
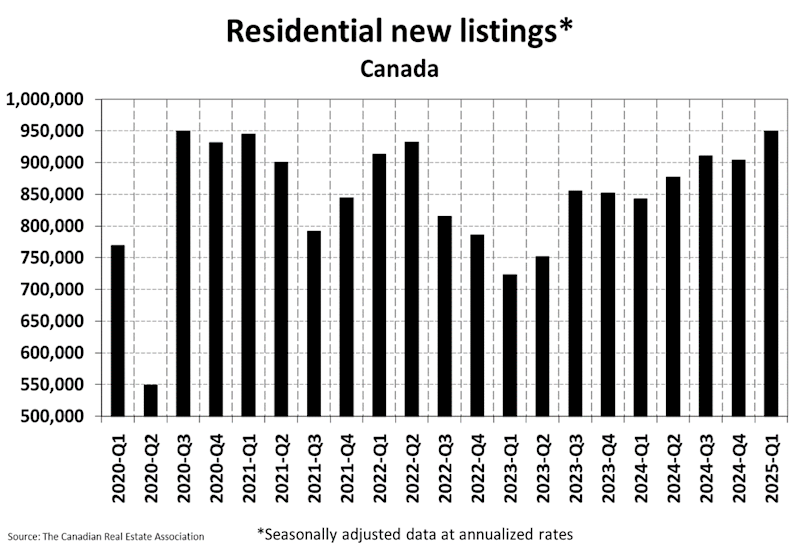
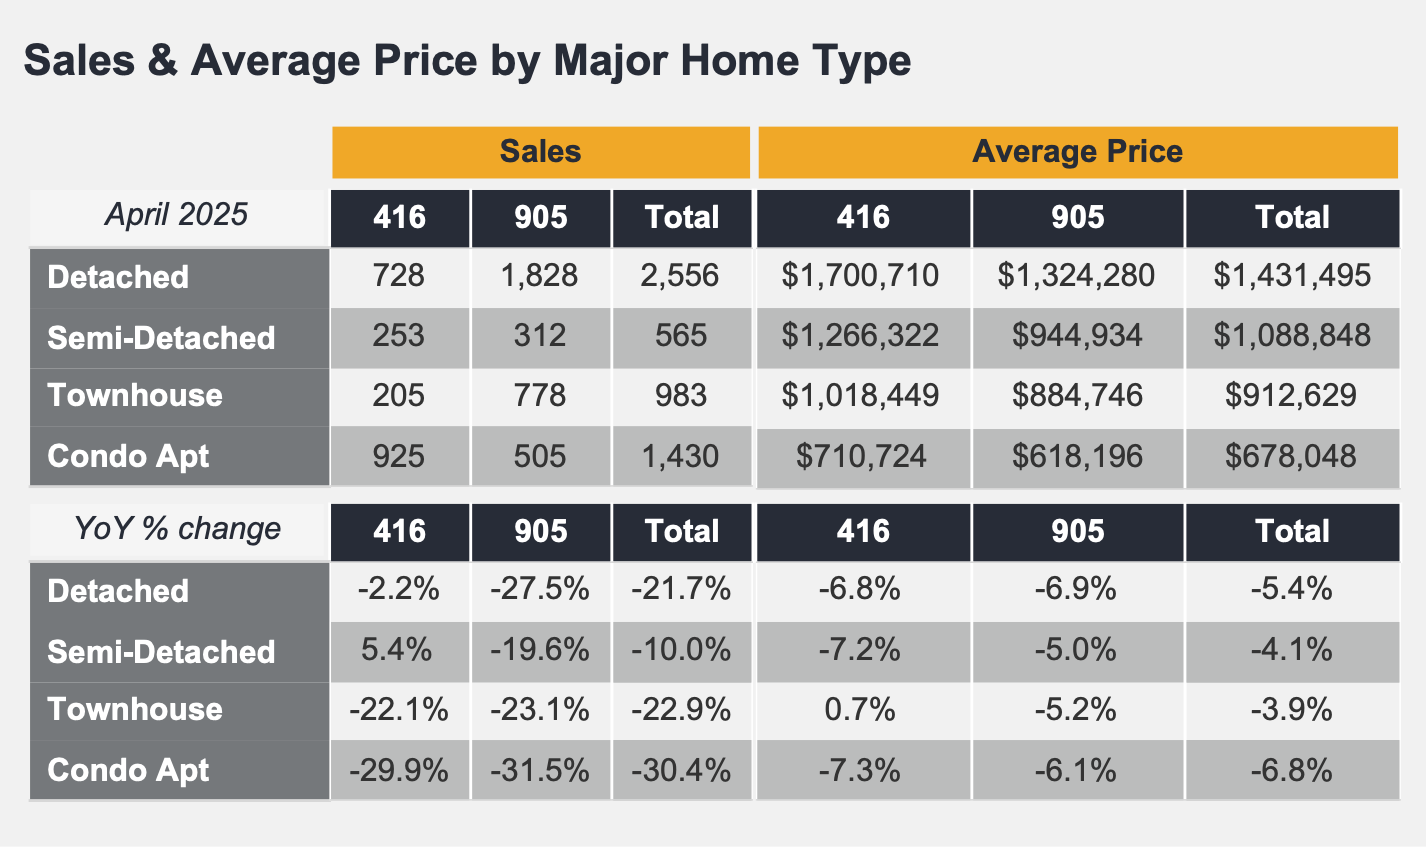
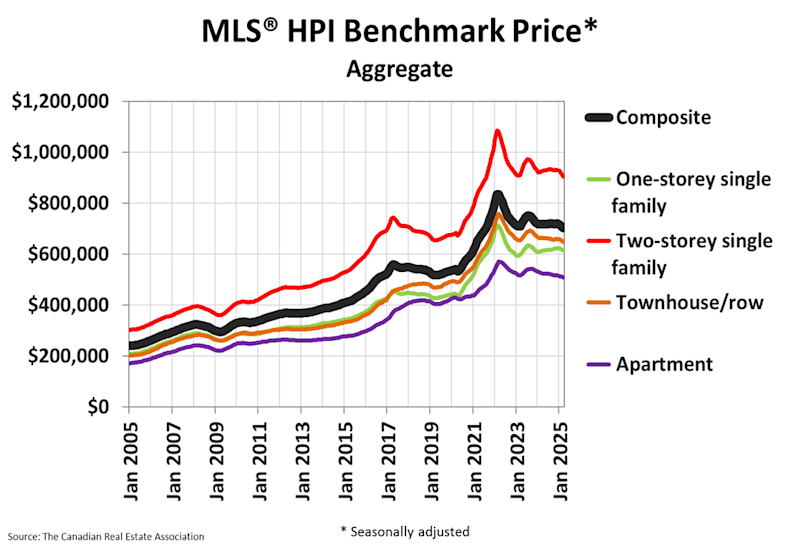
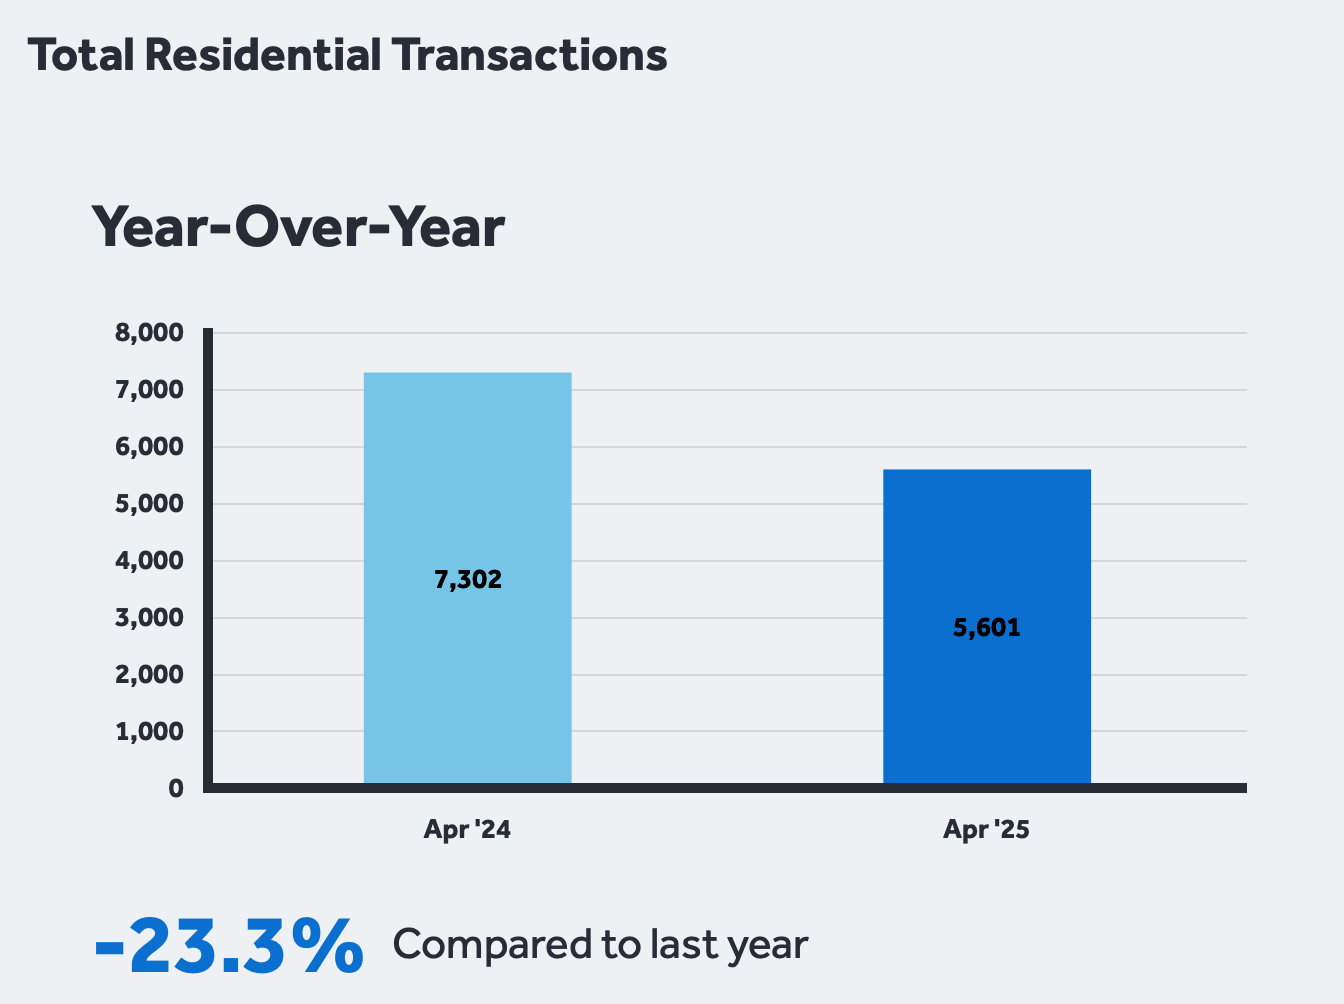
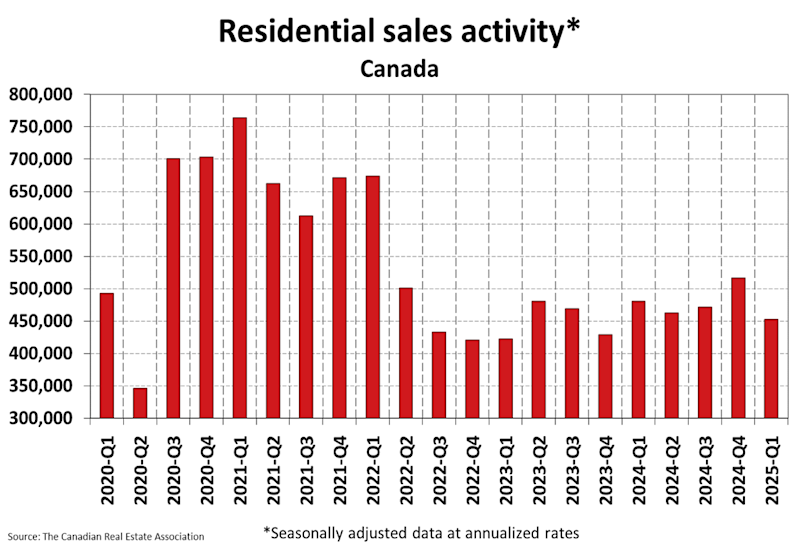
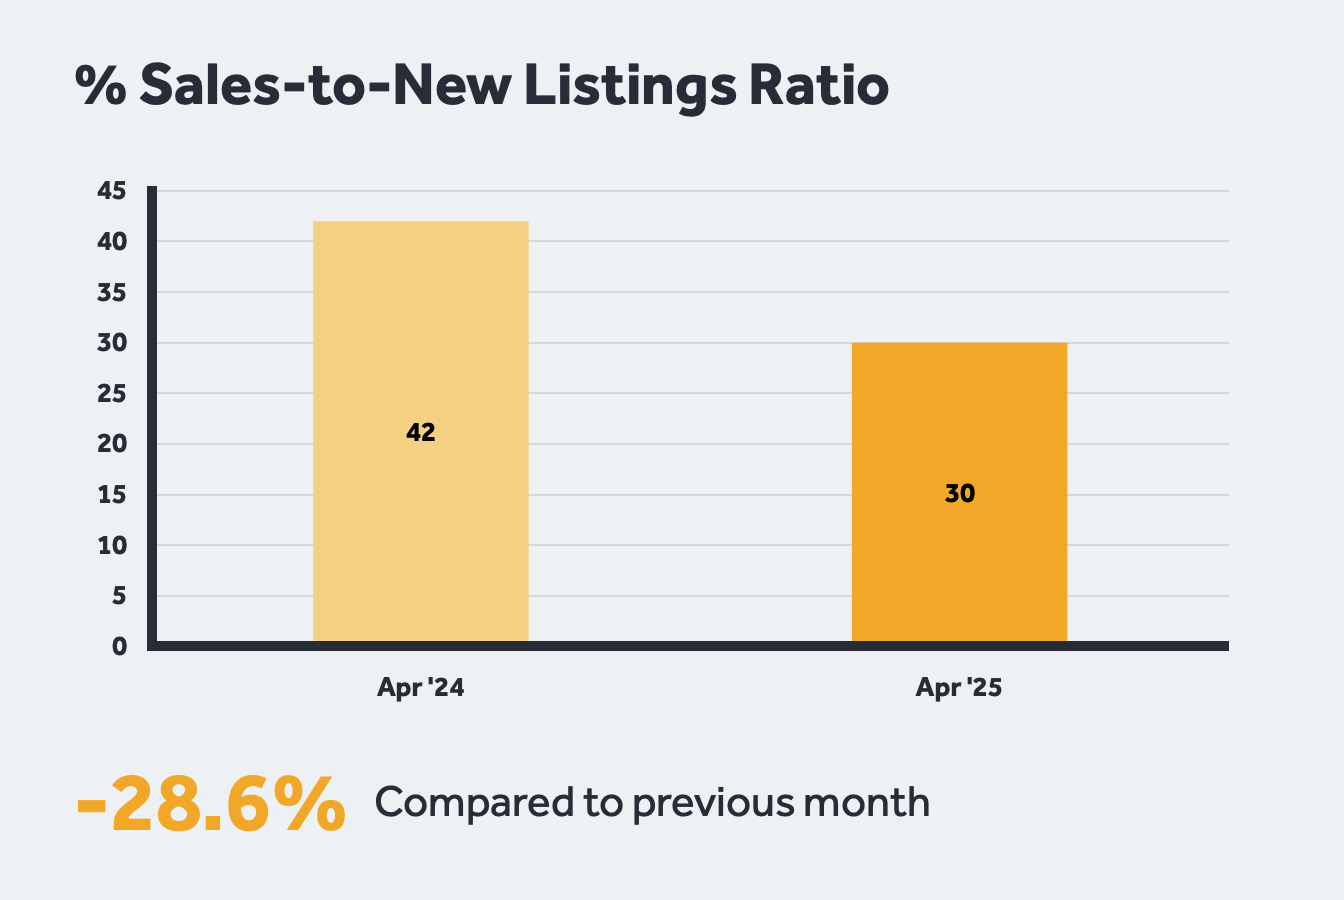
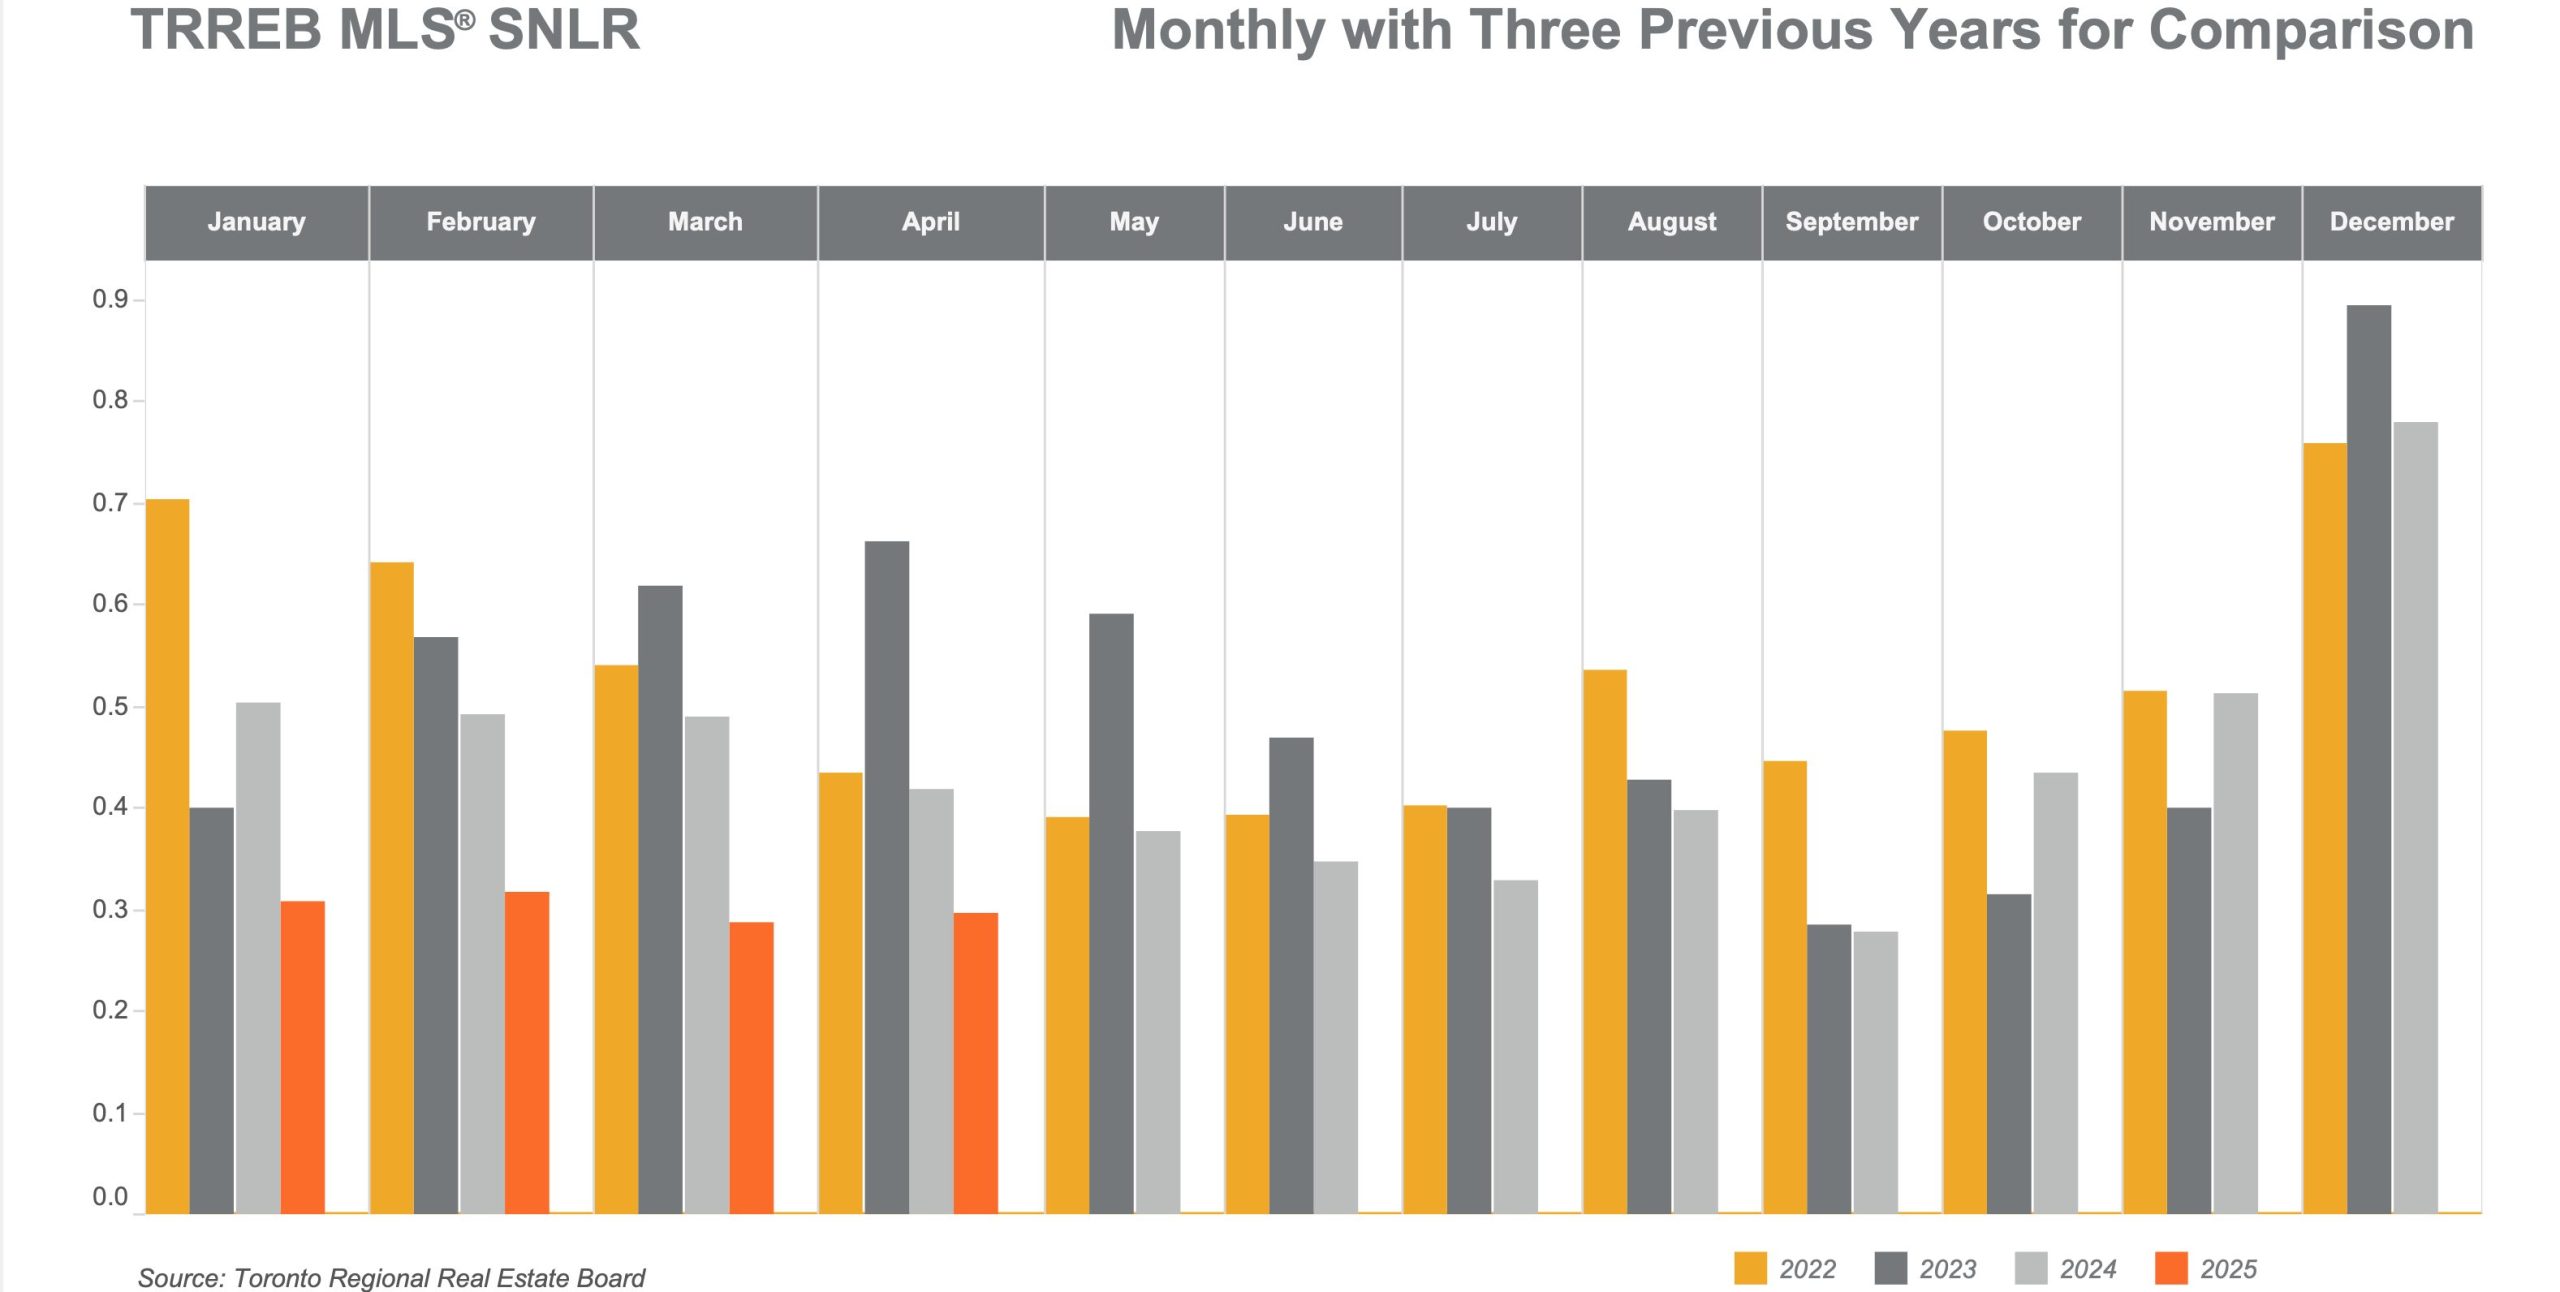
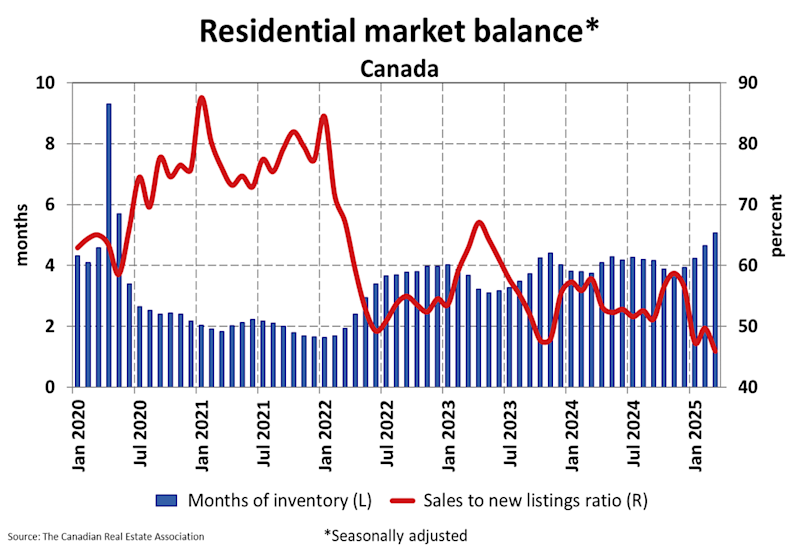

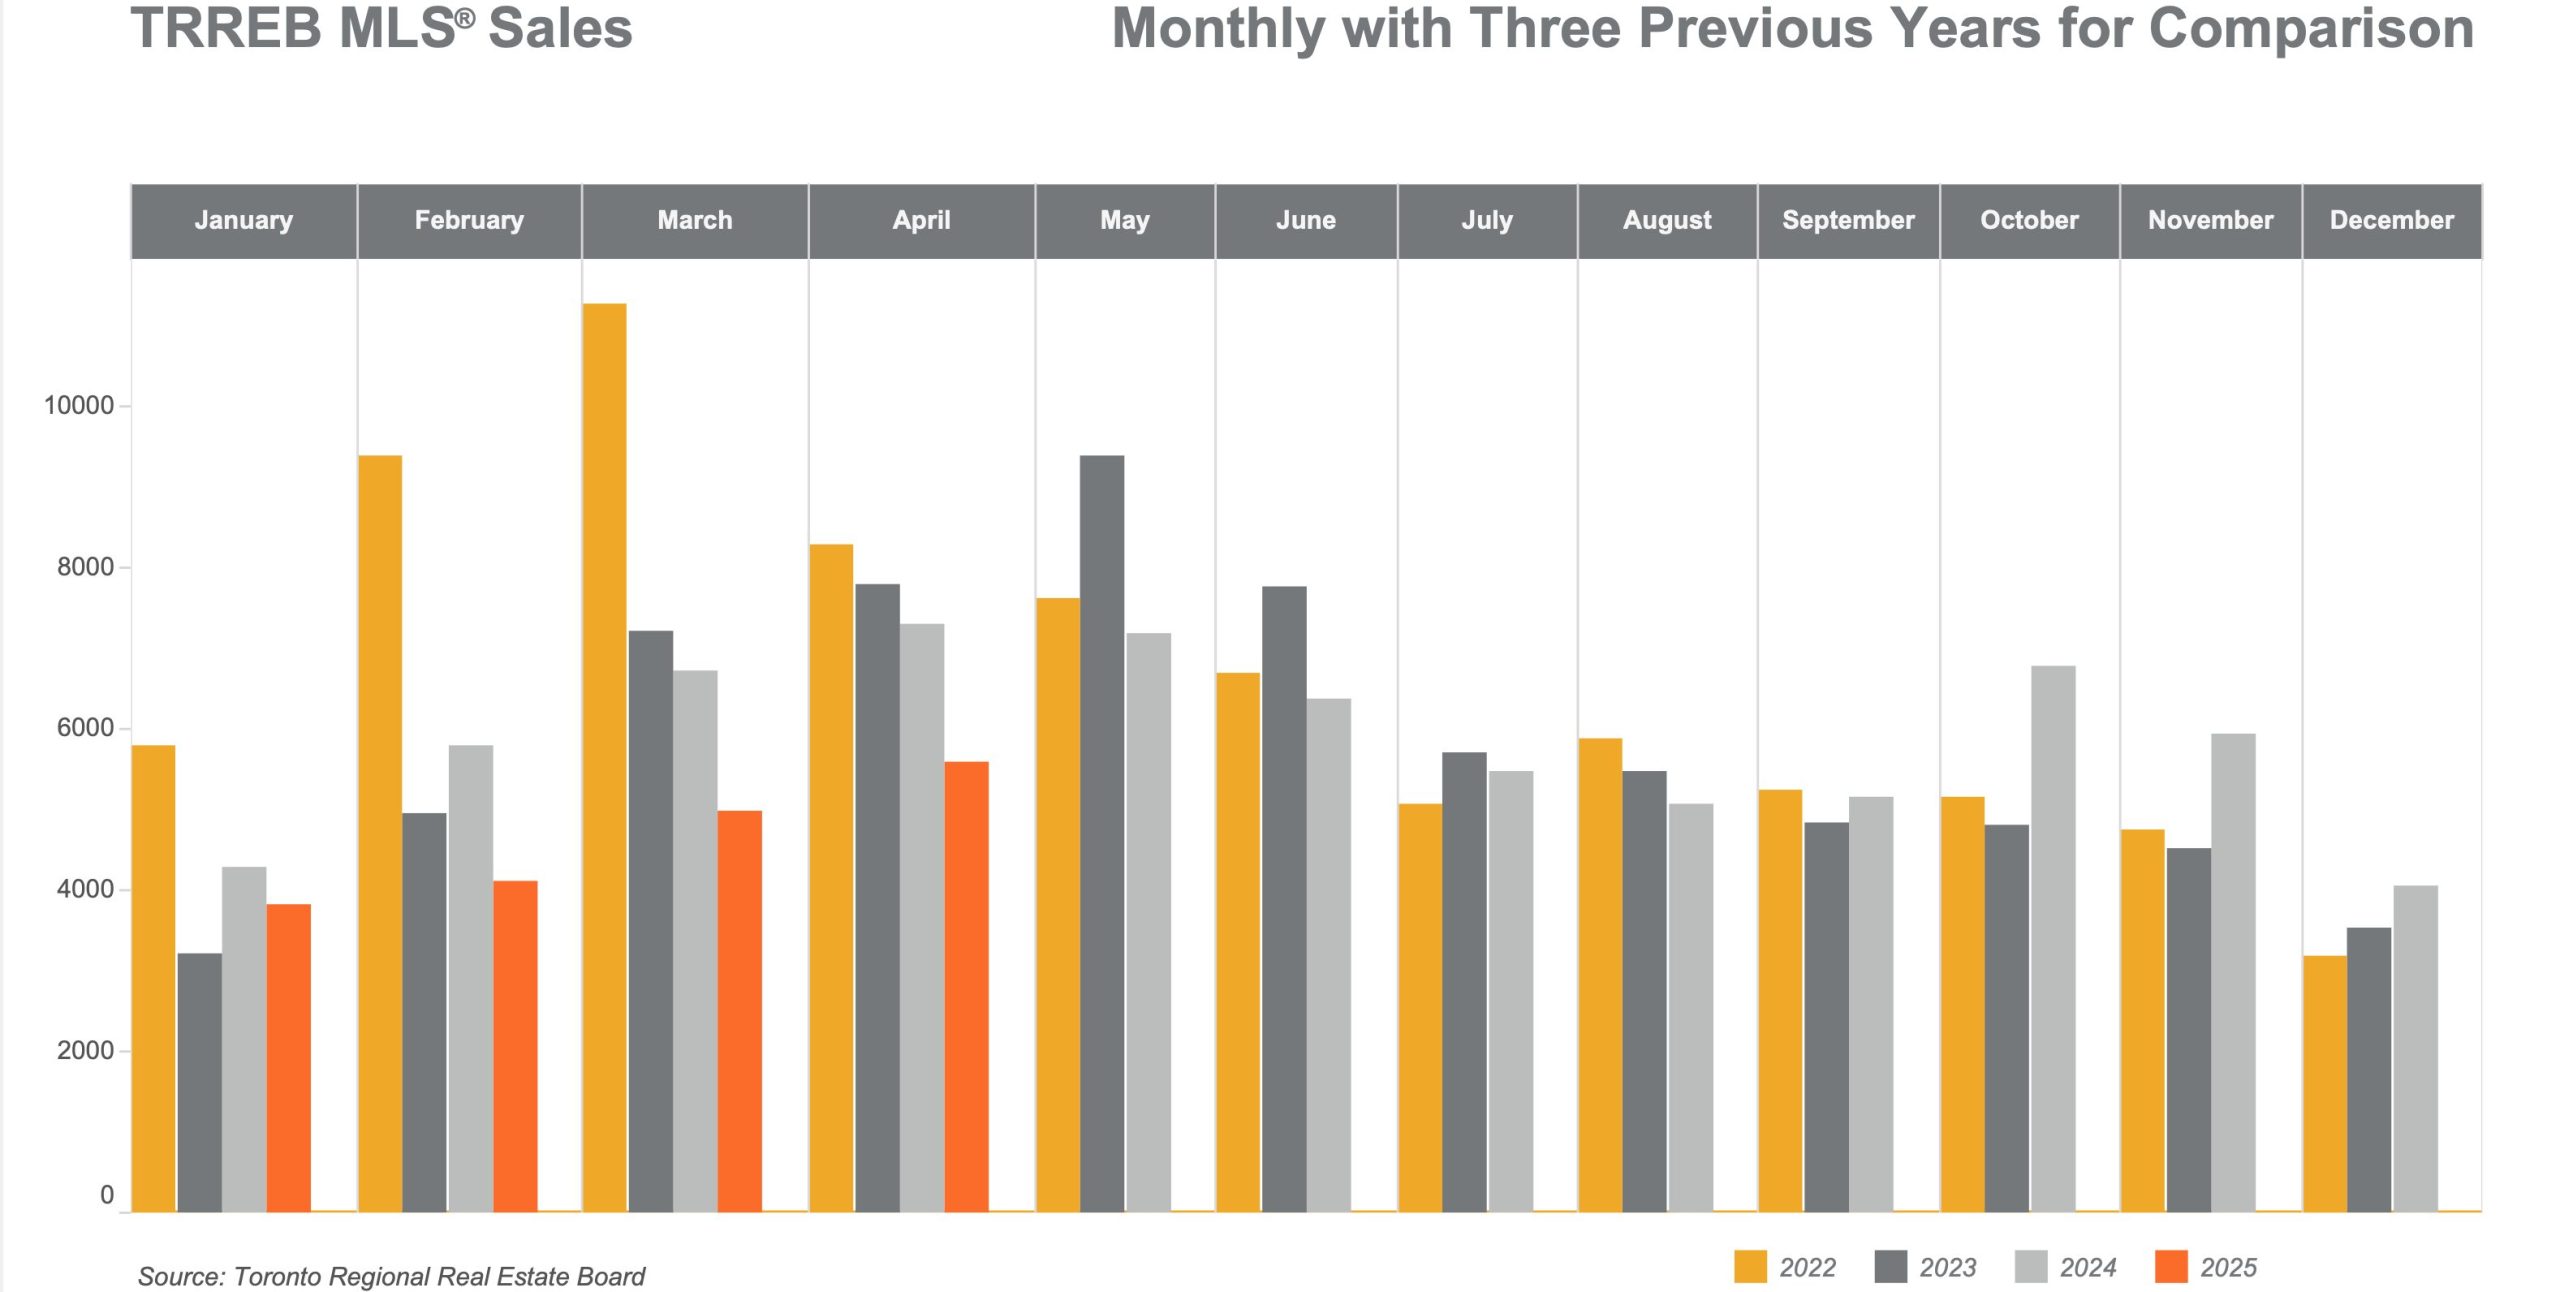

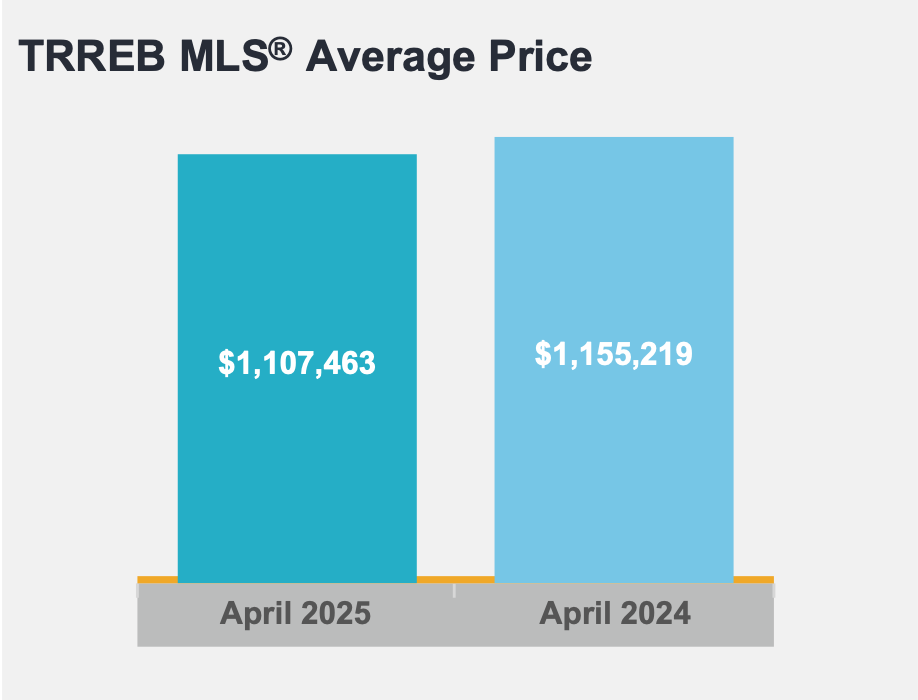
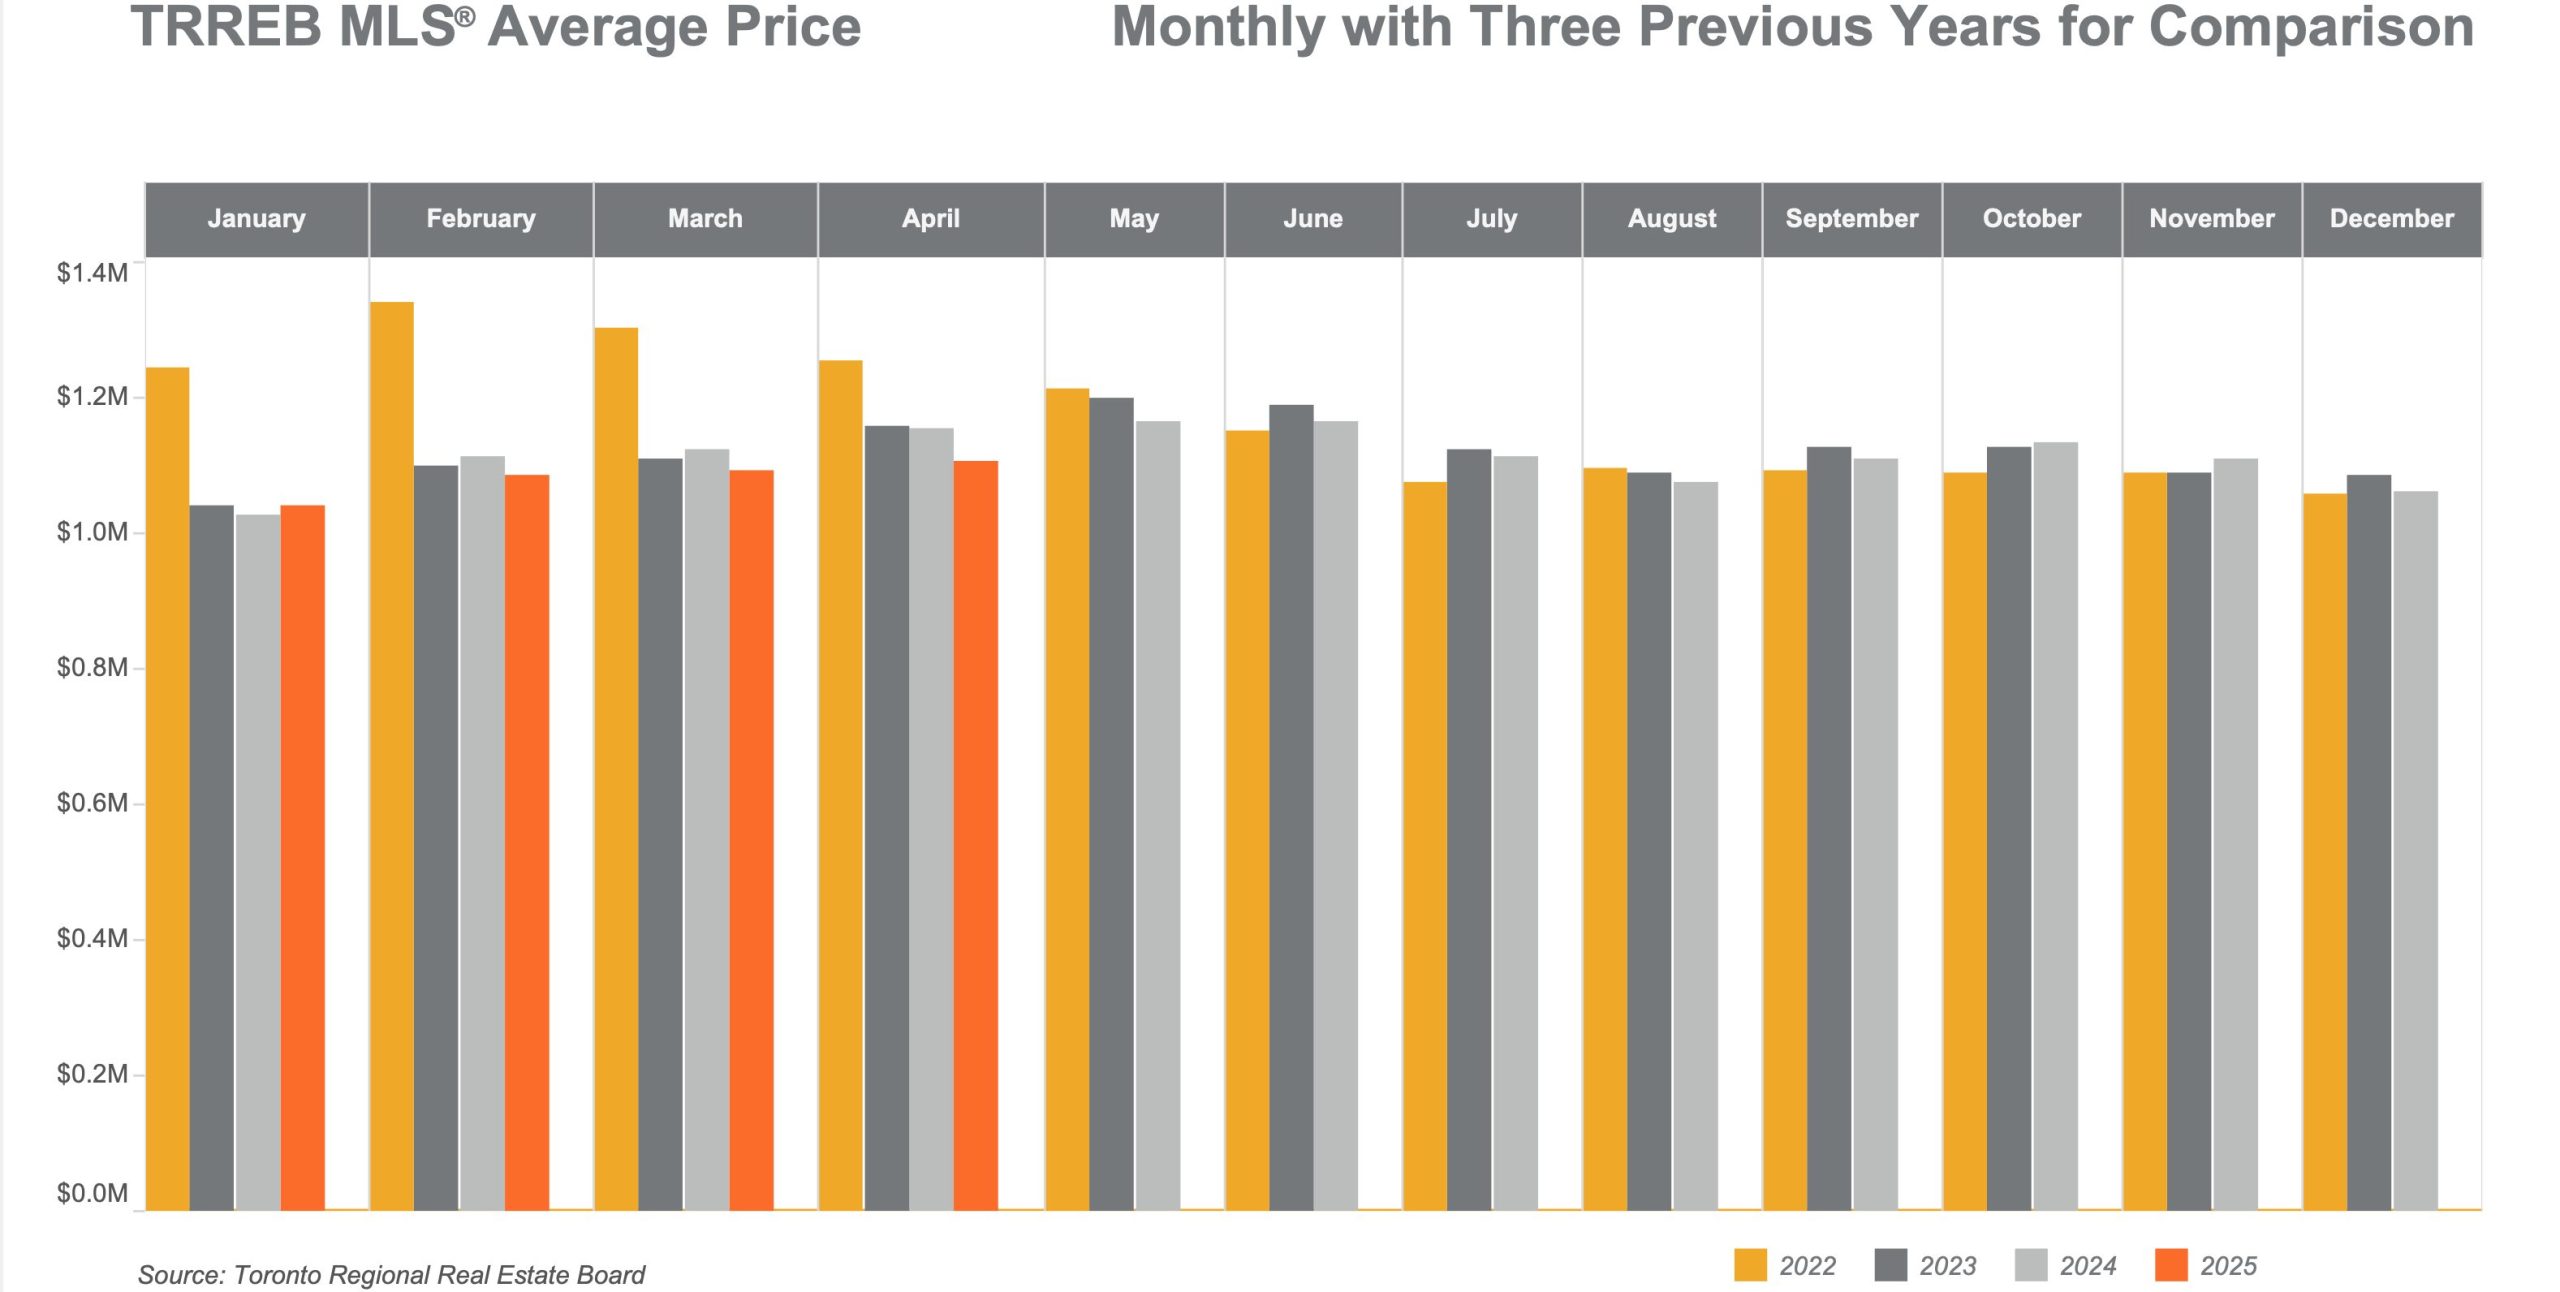
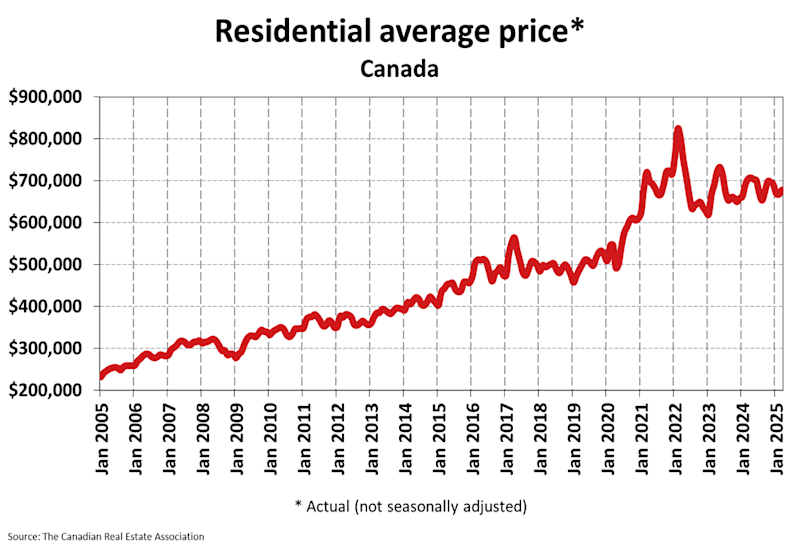


