
 Facebook
 X
X
 Pinterest
 Copy Link

The year 2025 began not with a bang of renewed activity, but with a quiet, persistent rustle of spreadsheet calculations echoing across the Greater Toronto Area (GTA). In a small, two-bedroom rental in Leslieville, Sarah and Mark—a couple in their early thirties—stared at a closing statement for a mid-sized townhouse in Durham Region that they had finally decided not to sign. Despite the Bank of Canada’s aggressive rate-cutting cycle, which saw the overnight rate retreat to 2.25% by late October, the fundamental math of the Toronto dream had changed. For Sarah and Mark, the relatable scenario was one of “cautious hesitation,” a sentiment shared by thousands of prospective buyers who found that even as borrowing costs eased, the cumulative weight of years of inflation on groceries and essentials had permanently altered their debt-service ratios. This was the year of the Great Rebalancing—a period where the emotional urgency of the pandemic era was replaced by a disciplined, strategy-first approach to property.
For sellers, the narrative was equally transformative. Consider the Hendersons in Uxbridge, who had watched their neighbors sell for record highs in 2022. Listing their detached home in early 2025, they were forced to confront a market where “active listings” had surged to levels not seen since 2009. Instead of a weekend bidding war, they faced an average of 31 to 34 days on the market and buyers who insisted on home inspections and financing conditions. This report serves as a definitive professional autopsy of the 2025 market, designed to provide institutional-grade clarity for buyers seeking entry, sellers navigating a reset, and renters finding their first real taste of leverage in a decade. By synthesizing thousands of data points from the Toronto Regional Real Estate Board (TRREB), the Massachusetts Institute of Technology (MIT), and federal housing agencies, this analysis establishes the 2025 market as a foundational pivot toward a more predictable, yet structurally different, 2026.
The Macroeconomic Crucible: Navigating Trade Headwinds and Fiscal Shifts
The performance of the GTA housing market in 2025 was fundamentally underpinned by a broader Canadian economy grappling with what the Bank of Canada described as a period of “subdued growth”. The national landscape was marred by trade uncertainty, particularly regarding widespread U.S. tariffs on steel, aluminum, and automotive sectors—industries that form the backbone of Southern Ontario’s industrial base. Real GDP for Canada contracted by 1.6% in the second quarter of 2025, a shock primarily attributed to declining exports and a pullback in business investment. This cooling at the federal level trickled down to the provincial economy, where Ontario’s real GDP growth was projected to decelerate to a modest 0.8% for the year.
For the real estate professional, these figures were more than just abstract statistics; they were the primary drivers of consumer confidence. The Toronto Census Metropolitan Area (CMA) faced a persistent labor market lag, with an annual unemployment rate standing at approximately 9.4% by the fourth quarter—a figure significantly higher than the national average of $6.9\%$. This disparity created a “confidence gap” where, despite falling mortgage rates, many households were reluctant to commit to long-term financial obligations while the industrial and manufacturing sectors faced structural headwinds.
Monetary Policy and the Affordability Paradox
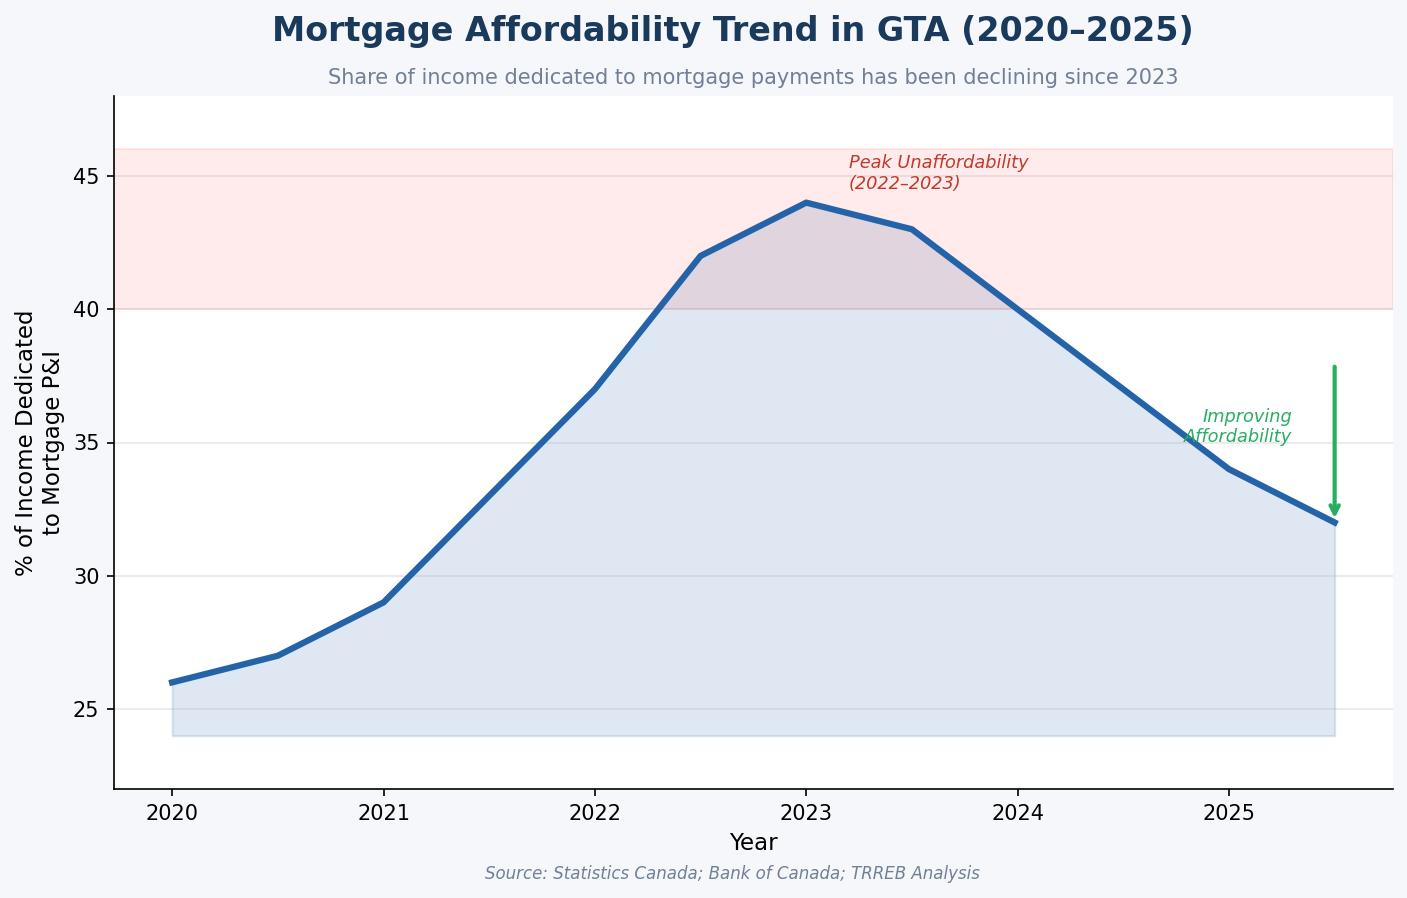
The Bank of Canada’s monetary response was the primary catalyst for market stabilization. By October 29, 2025, the benchmark rate had been cut to 2.25%, a cumulative drop of 2.75% from the 5.0% peak seen in early 2024. This led to a significant easing in the mortgage landscape, with five-year insured fixed rates dipping as low as $3.69% and variable rates hitting 3.45%. However, the anticipated “flood of buyers” failed to materialize in the first half of the year. The reason, as analyzed by TRREB and Ipsos, was that while interest rates were falling, home prices had not yet corrected enough to offset the increased cost of living.
| Economic Indicator | 2025 Full Year (Estimated) | 2024 Full Year (Actual) | Impact Direction |
| Canada Real GDP Growth | 0.75% | 1.1% | Negative/Slowing |
| Ontario Real GDP Growth | 0.8% | 1.4% | Negative/Slowing |
| Toronto Unemployment Rate | 9.4% | 8.2% | Negative/Rising |
| BoC Overnight Rate (Year-End) | 2.25% | 5.0% | Positive/Falling |
| CPI Inflation (Ontario Avg) | 1.9% | 2.4% | Positive/Stabilizing |
The analysis suggests that 2025 was the year the “Pressure Point”—the intersection of housing supply, migration, and the missing middle—became the central focus of policymakers. While inflation moderated to near the 2% target, the cumulative effect of the previous years’ price surges left household budgets permanently elevated. Groceries remained 25%-30% more expensive than in 2019, and GTA rents had climbed 40% over the same period, creating a “trap” for renters who wished to save for a down payment but were consumed by monthly carrying costs.
Thinking about how these macro trends affect your specific neighborhood? Connect with a local market expert for a personalized valuation.
The Migration Phenomenon: The Erosion of the Urban Premium
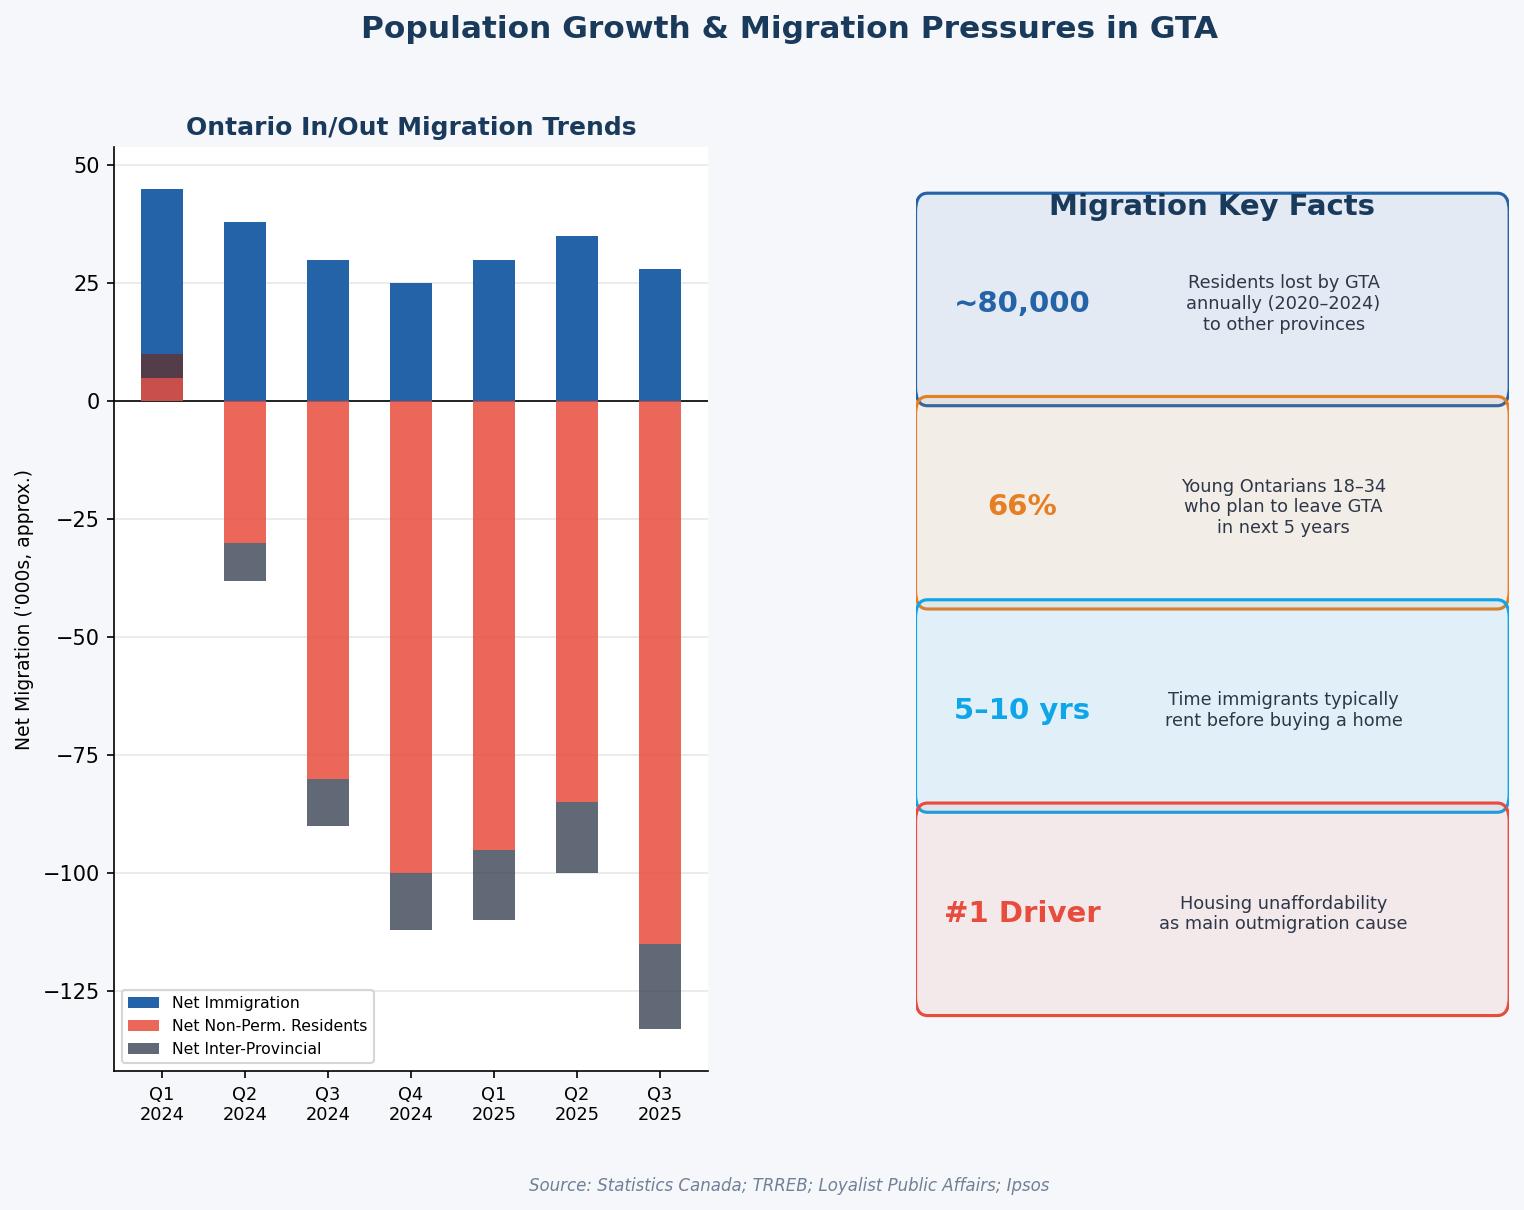
A defining characteristic of 2025 was the acceleration of outmigration from the GTA. Excluding international immigration, the region lost an average of 80,000 residents annually to other parts of Ontario and the rest of Canada. This movement was not merely a lifestyle choice but a fiscal necessity. The “urban premium”—the idea that living in Toronto was worth the exorbitant cost for the sake of proximity to jobs—began to dissolve under the weight of remote work and infrastructure failure.
The Cost of Congestion and Infrastructure Stagnation
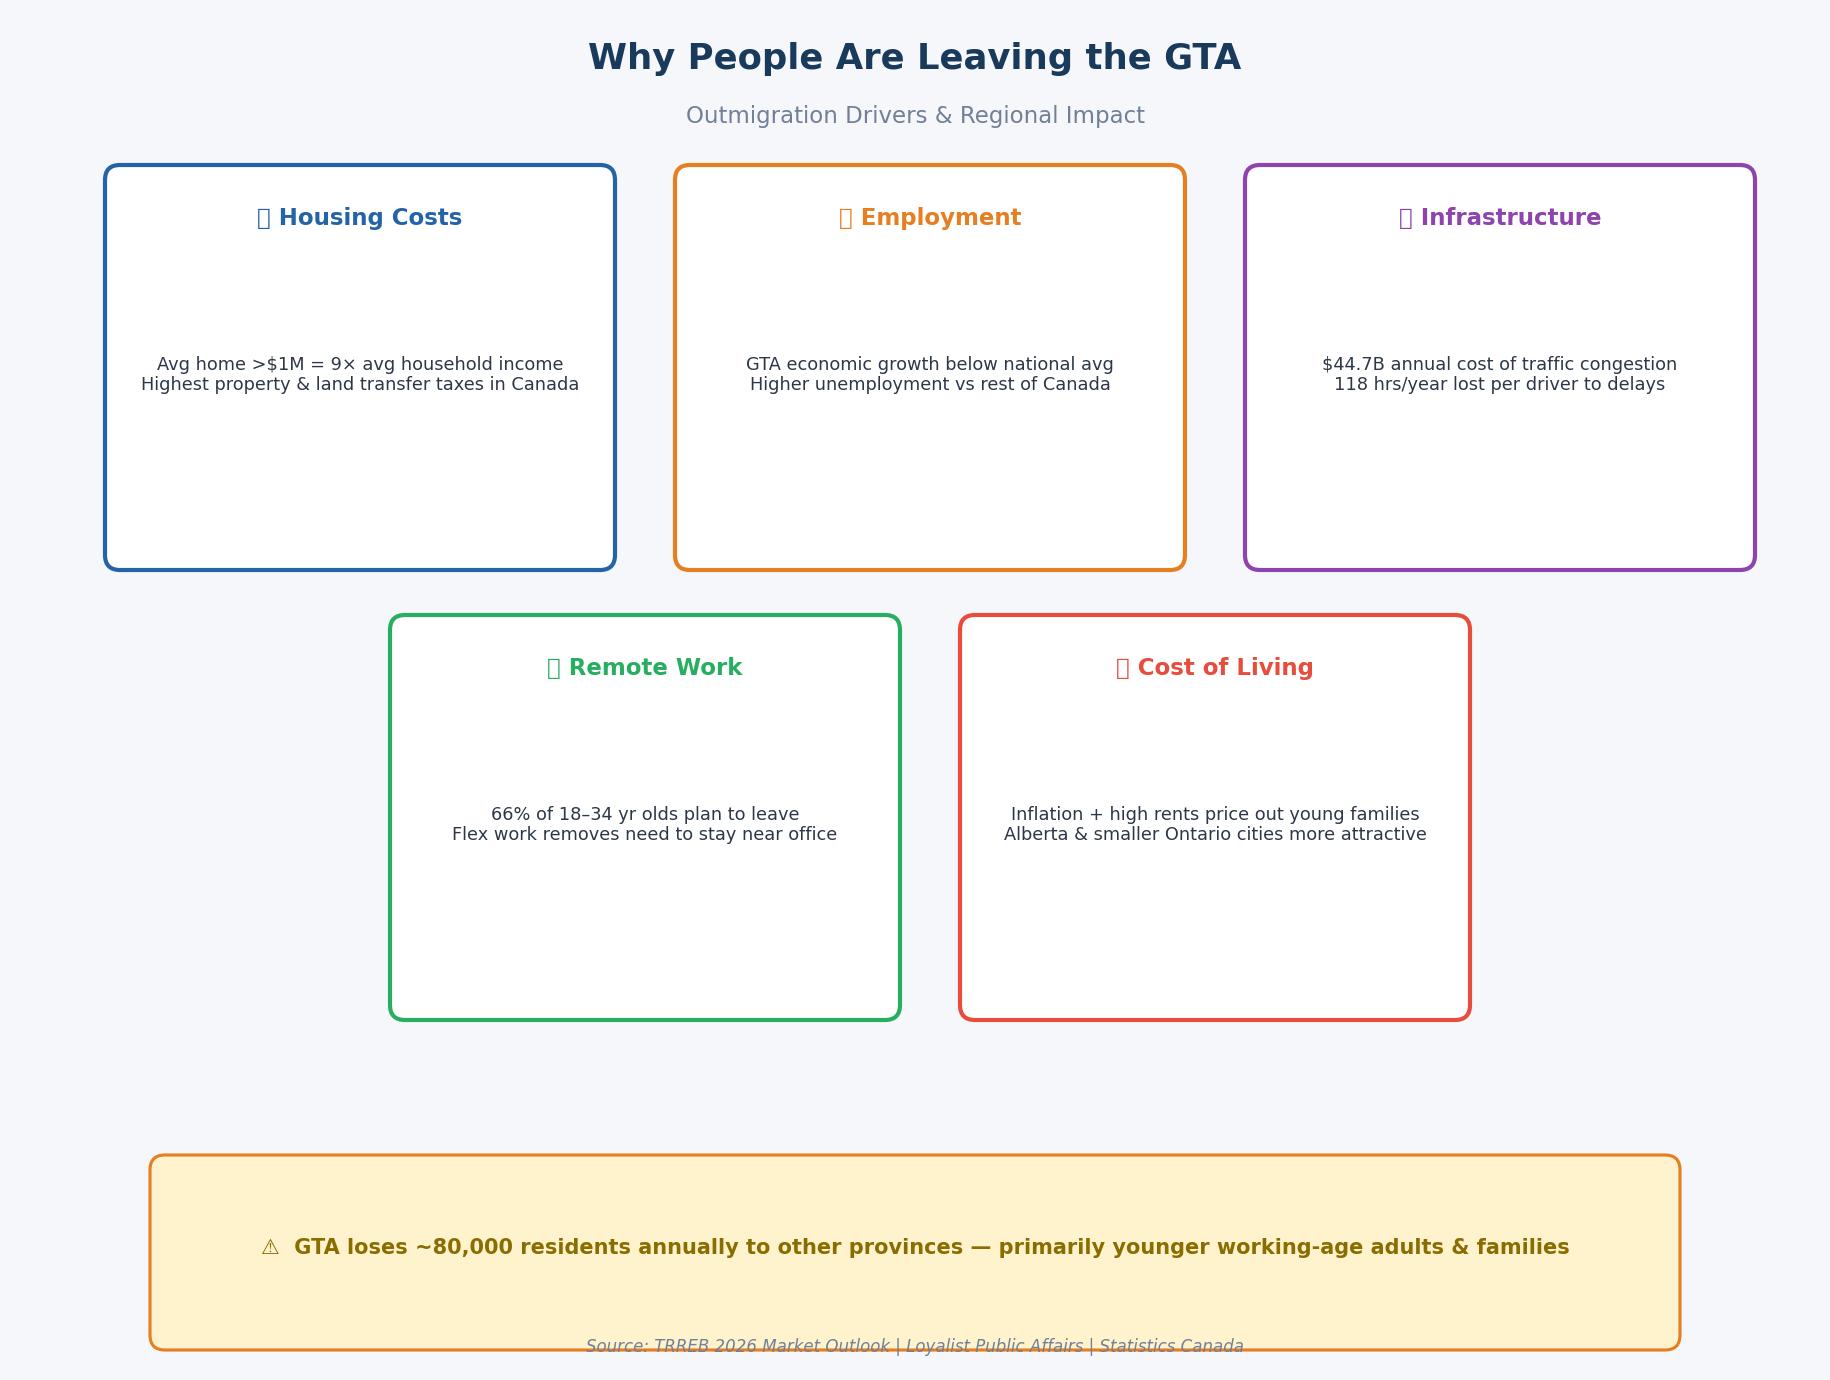
For the average professional, the GTA’s infrastructure became a primary driver of relocation. Toronto’s traffic congestion was ranked among the worst in North America, with drivers losing approximately 118 hours each year to delays. This was not just a frustration; it was an economic drain, costing the region roughly $44.7 billion annually in combined social and economic losses. Ipsos polling indicated that 53% of residents had considered leaving the GTA specifically because of gridlock.
The normalization of remote and hybrid work provided the “escape hatch” residents needed. By late 2024, 28.8% of the Toronto labor force worked in a hybrid or fully remote capacity. This enabled a mass exodus of young families and professionals to more affordable communities where they could access larger living spaces without sacrificing their Toronto-based salaries.
The Alberta and Small-Town Ontario Allure
The financial incentive to relocate was most apparent when comparing the carrying costs of homeownership across Canadian jurisdictions. A household moving from Toronto to Calgary or a mid-sized Ontario city like Uxbridge or London found immediate relief in lower property taxes and the absence of a municipal land transfer tax.
| Ownership Cost Factor | City of Toronto | City of Calgary | City of Mississauga |
| Avg. Home Price (Sept 2025) | $1,089,918 | $615,005 | $969,501 |
| Res. Property Tax Rate | 0.7541% | 0.6180% | 1.0338% |
| Estimated Annual Tax | $8,219 | $3,990 | $9,950 |
| Land Transfer Tax (LTT) | Double (Prov + Mun) | No LTT (Title Fee Only) | Single (Prov Only) |
The evidence indicates that a Toronto homeowner pays roughly double the annual property tax of a comparable Calgary homeowner, while a Mississauga homeowner pays nearly three times more. This recurring financial burden, when layered onto elevated mortgage and utility costs, became a primary catalyst for outmigration among the 66% of young Ontarians (aged 18-34) who expressed a desire to leave the region.
Residential Segments: A Tale of Two Markets
 The 2025 residential market was a study in contrasts, characterized by a resilient but normalizing freehold sector and an oversupplied, investor-strained condominium segment.
Freehold Resilience: The Detached and Semi-Detached Reset
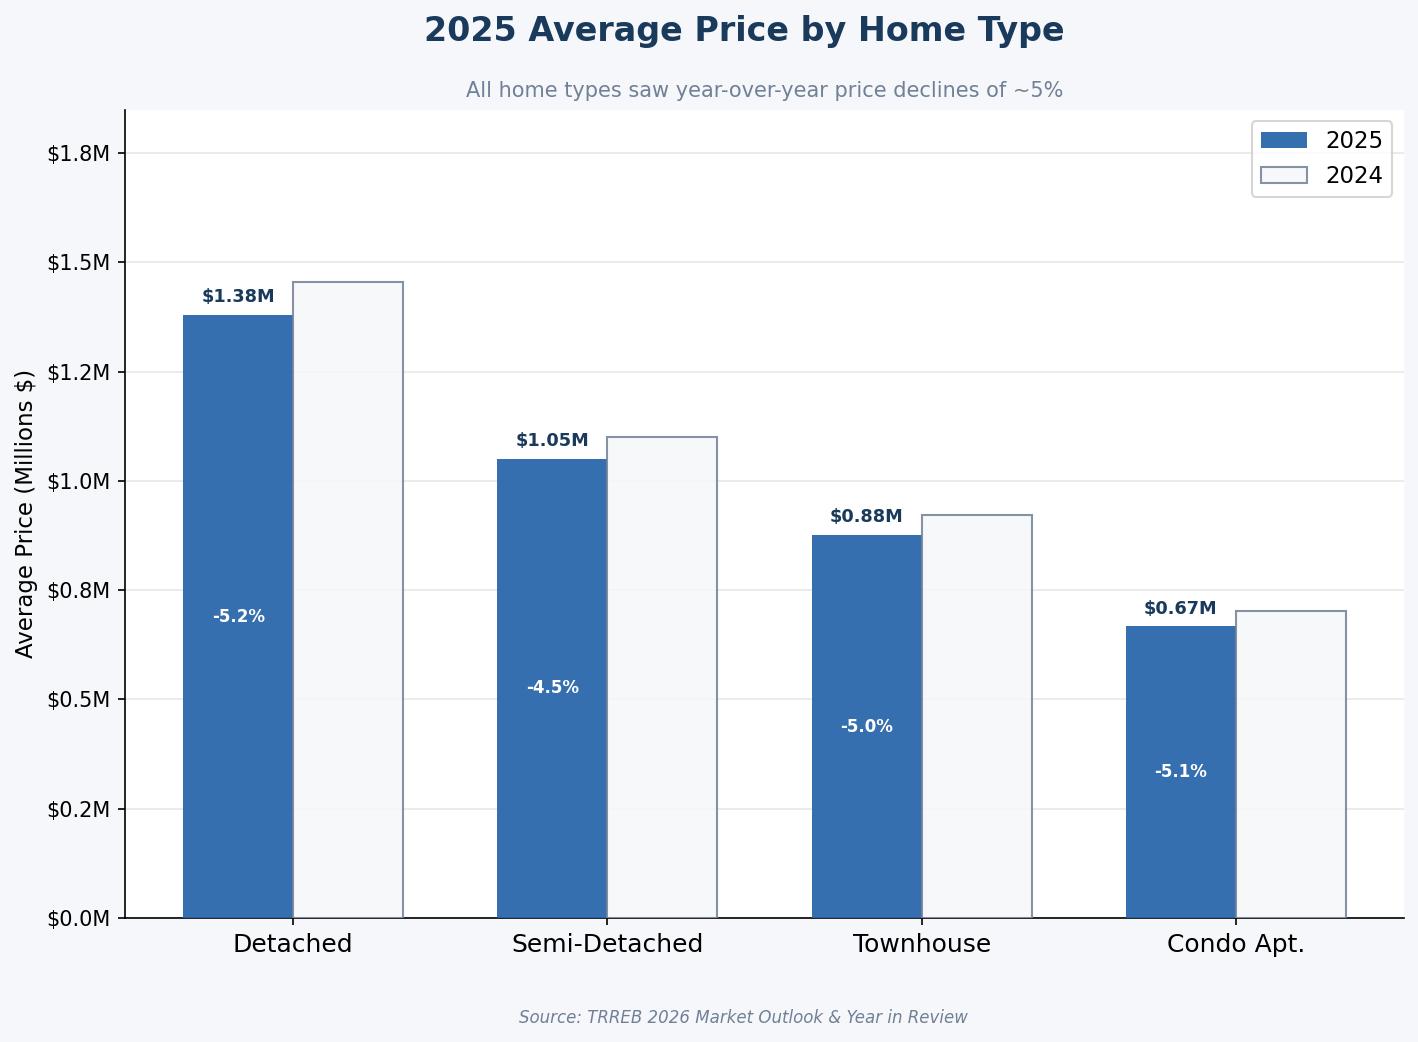
Detached homes remained the most coveted asset class in 2025, but they were not immune to the broader market rebalancing. The average price for a detached home in the GTA fell by 5.2% to approximately $1,379,666. This correction was seen by industry professionals as a “reset” rather than a “crash.” Sellers who recognized the shift toward balanced conditions and priced their homes accurately continued to find success, while those anchored to 2022 expectations saw their properties sit for months.
Semi-detached homes and townhouses proved slightly more resilient, with semi-detached prices declining by a more modest 4.5% to $1,050,605. The growth in new listings for these segments—up 17.3% for semi-detached and 9.3% for townhouses—provided move-up buyers with a level of choice that had been absent for the better part of a decade.
The Condominium Crisis: Inventory at a Crossroads
The condominium apartment segment faced the most significant challenges in 2025. Sales volume for condos dropped by $14.7\%$ year-over-year, while the average selling price fell by 5.1% to $667,235. The sector was impacted by a “perfect storm” of factors:
-
High Listing Inventory: Active listings in the condo segment reached historic highs, giving buyers unprecedented negotiating power.
-
Investor Pullback: As average rents trended lower and short-term rental regulations tightened, many investors found their units to be cash-flow negative, leading them to list properties rather than continue to hold.
-
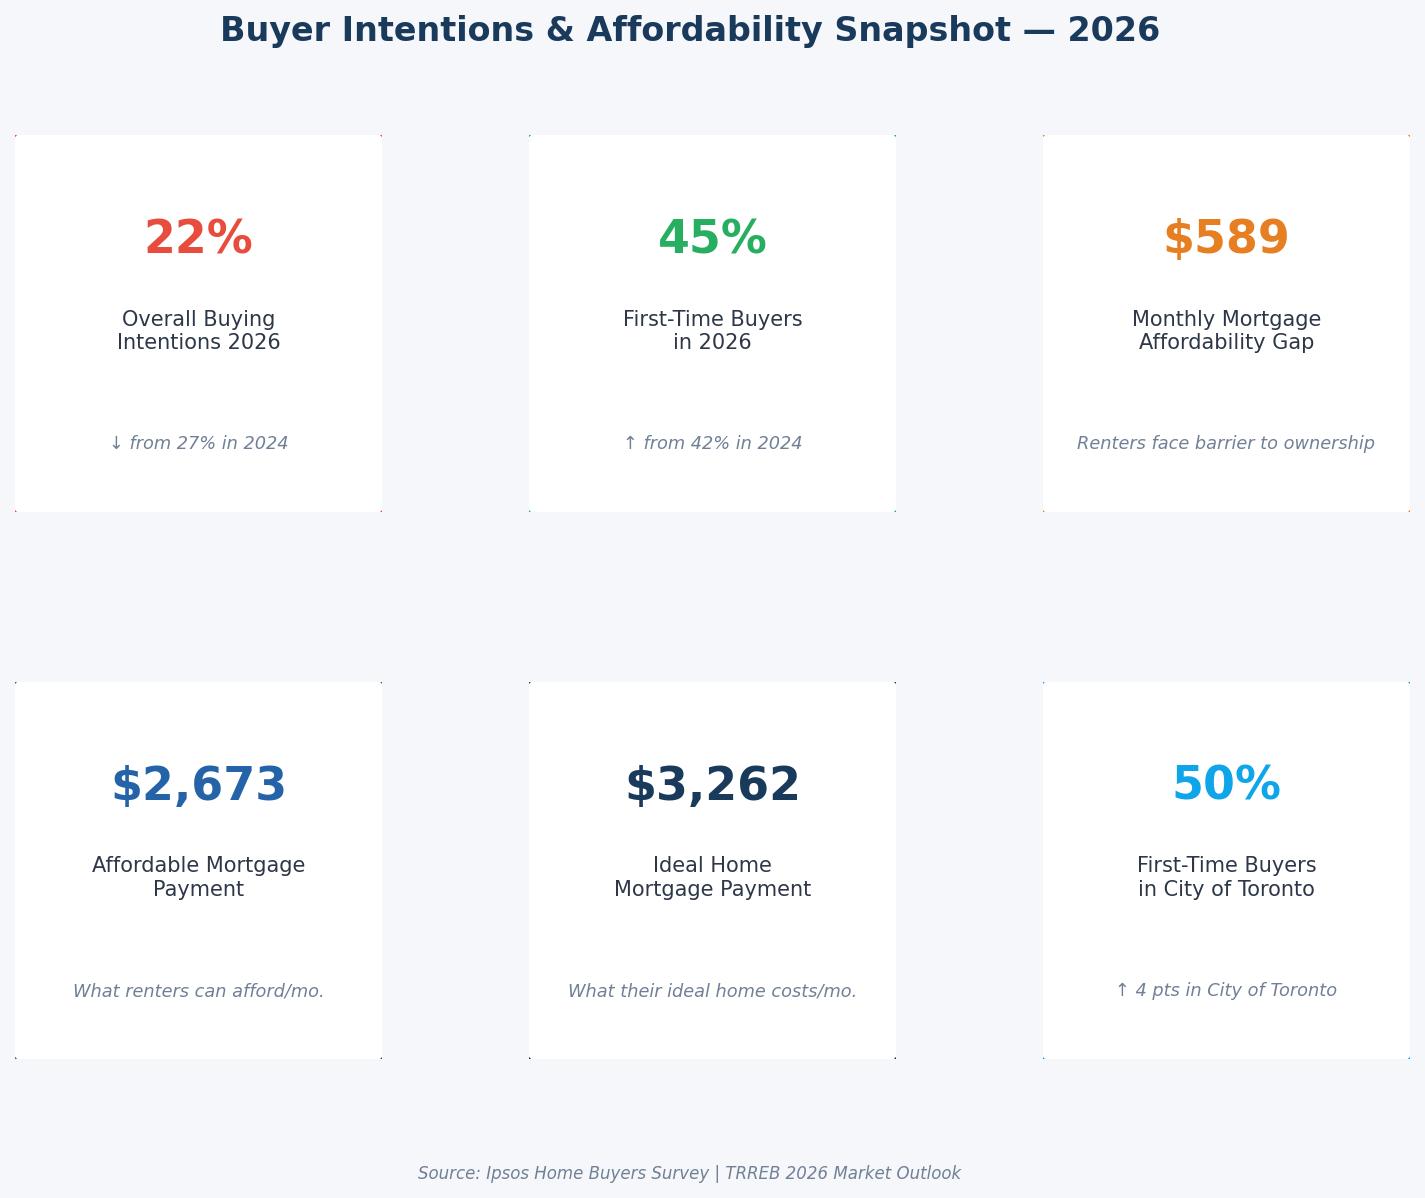
The First-Time Buyer Gap: Despite being the most affordable housing type, Ipsos polling found a persistent gap of approximately $600 between what typical renter households could afford for a monthly mortgage and the actual cost of a condo unit.
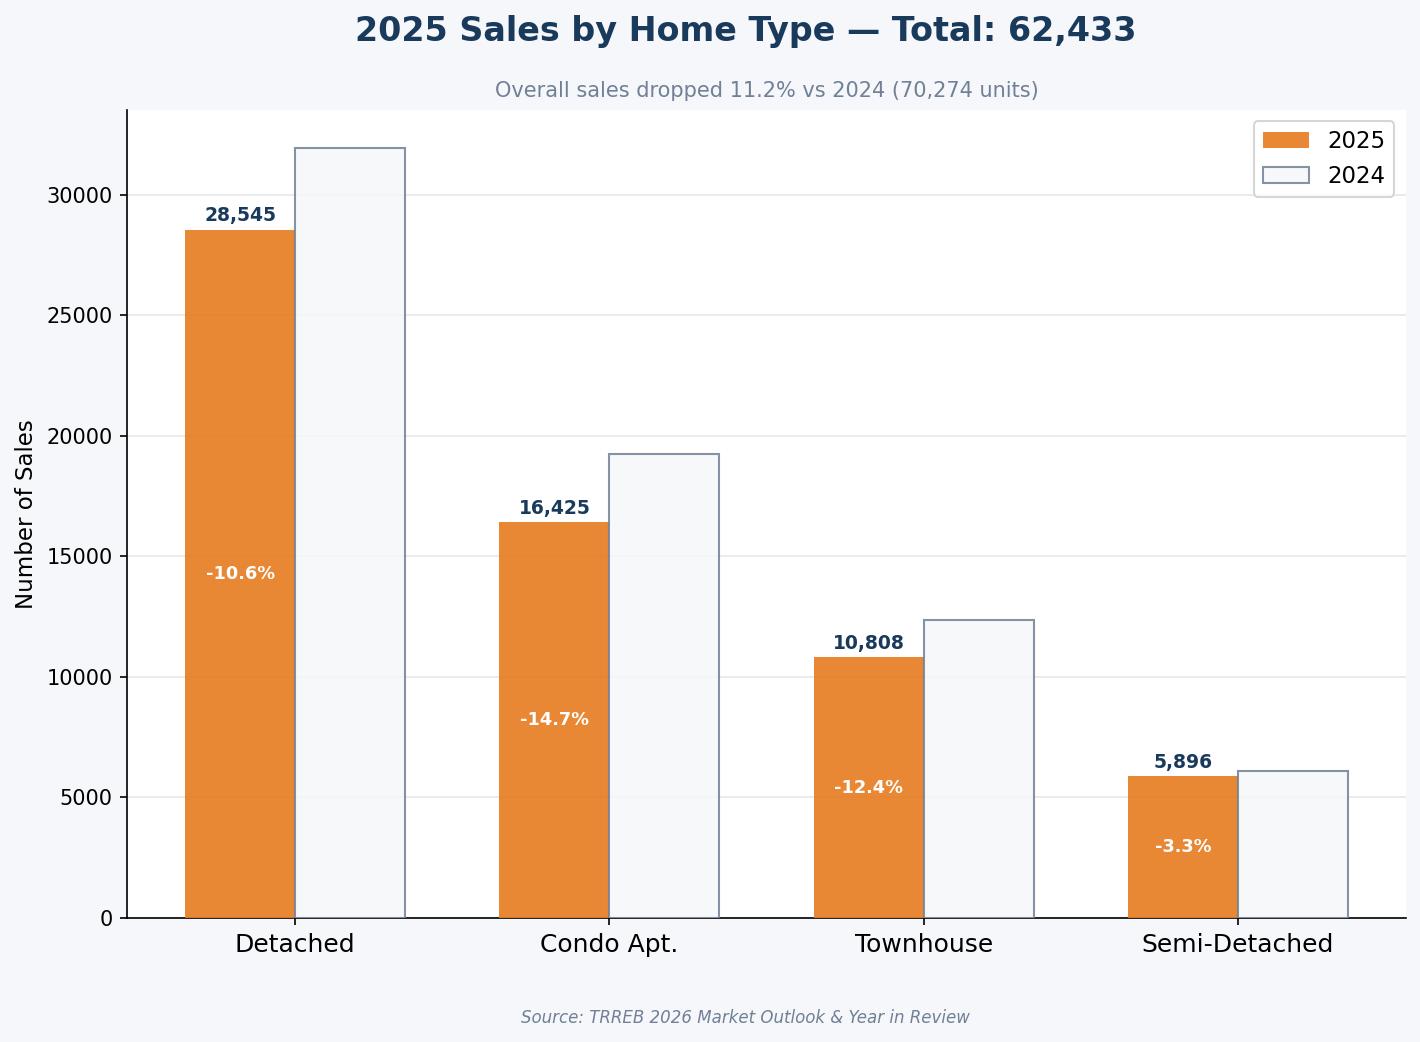
| Housing Type | 2025 Avg. Price | 2024 Avg. Price | Price Change (%) | Sales Change (%) |
| Detached | $1,379,666 | $1,456,039 | -5.2% | -10.6% |
| Semi-Detached | $1,050,605 | $1,099,883 | -4.5% | -3.3% |
| Townhouse | $876,354 | $922,207 | -5.0% | -12.4% |
| Condo Apartment | $667,235 | $702,943 | -5.1% | -14.7% |
The data suggests that the condo market in 2025 became a “buyer’s playground,” where offer conditions and price negotiations replaced the bidding wars of the past. For buyers like Sarah and Mark, this segment finally offered a point of entry, provided they were willing to navigate the complexities of high maintenance fees and building-specific financials.
Are you an investor looking to navigate the condo market? (https://www.multiplelistings.ca/on/toronto)
Policy and Planning: The Multiplex Zoning Experiment
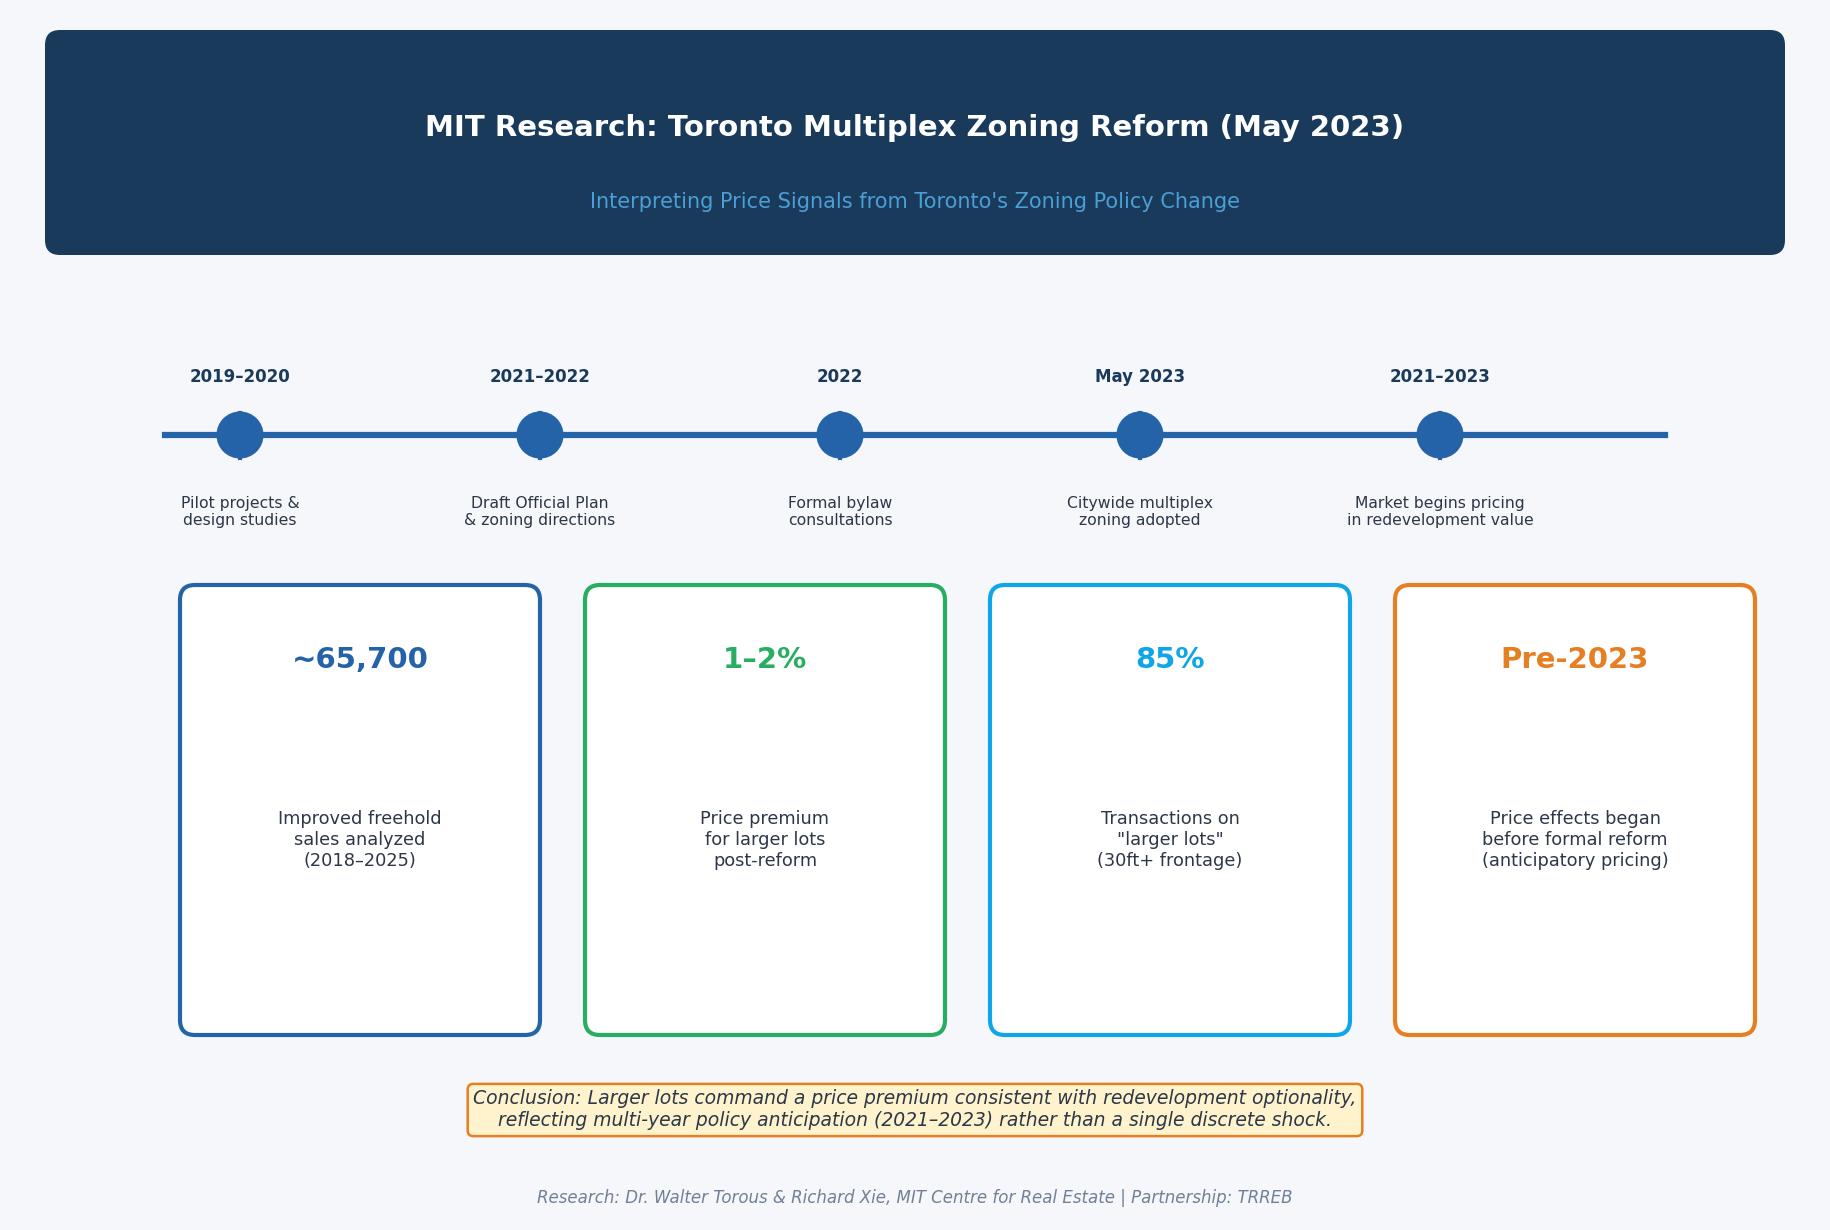
One of the most profound shifts in the Toronto planning landscape occurred in May 2023, when the city adopted a citywide zoning reform allowing two- to four-unit residential buildings (“multiplexes”) as-of-right. In 2025, researchers from MIT’s Centre for Real Estate published an exploratory assessment of how this policy was being reflected in land values.
MIT Research Findings on Land Value
The analysis, which utilized approximately 65,700 improved freehold sales within Toronto between 2018 and 2025, sought to determine if the “optionality” of building a multiplex was being priced into the market.
-
Larger Lots: The study defined “larger lots” as those with a frontage of at least 30 feet or an area of at least 3,000 square feet. These lots represent roughly 85% of the transactions in Toronto’s low-rise neighborhoods. Price Signal: The baseline model estimated a modest 1%-2% relative price increase for larger lots following the reform.
-
The Anticipation Effect: A critical insight from the MIT research was that the price gap between larger and smaller lots began widening as early as 2021-2022. This suggests that the market had already “priced in” the multiplex reform through years of public signals, pilot projects, and policy discussions before the formal bylaw was ever enacted.
The evidence indicates that while zoning reform is a necessary step toward addressing the “missing middle,” the market’s response is gradual and influenced by broader economic factors like construction costs and interest rates. For the homeowner, this means that while their lot might have gained some “redevelopment value,” the ability to realize that value depends on site-specific buildability and current financing conditions.
Fiscal Policy: Tax Relief and the Cost of Development
In a year defined by affordability concerns, governments at all levels were forced to take action. The 2025 Federal Budget and the Ontario Fall Economic Statement introduced several measures designed to lower the barrier to entry for first-time buyers.
The GST/HST Rebate Revolution
Effective May 27, 2025, the federal government introduced a 100% rebate of the 5% federal GST on newly built homes priced up to $1 million for first-time buyers. This initiative was designed to encourage new home construction and provide significant upfront relief—up to $50,000—to buyers. The Ontario government mirrored this at the provincial level, announcing the removal of the provincial 8% HST portion for first-time buyers of new homes effective January 1, 2026. Together, these rebates represent a massive reduction in closing costs for the “missing middle” segment, where new homes often hover between $800,000 and $1.2 million.
 The Burden of Development Charges
 The Burden of Development Charges
Despite these tax cuts, the cost of bringing new supply to market in the GTA remained punishingly high. Development charges—fees collected from developers to fund municipal infrastructure—saw significant increases.
-
Low-Rise Homes: Average charges in the GTA hit $123,649 per unit in 2025, an increase of $42,000 since 2022.
-
High-Rise Homes: Average charges hit $68,608 per unit, up $32,000 since 2022.
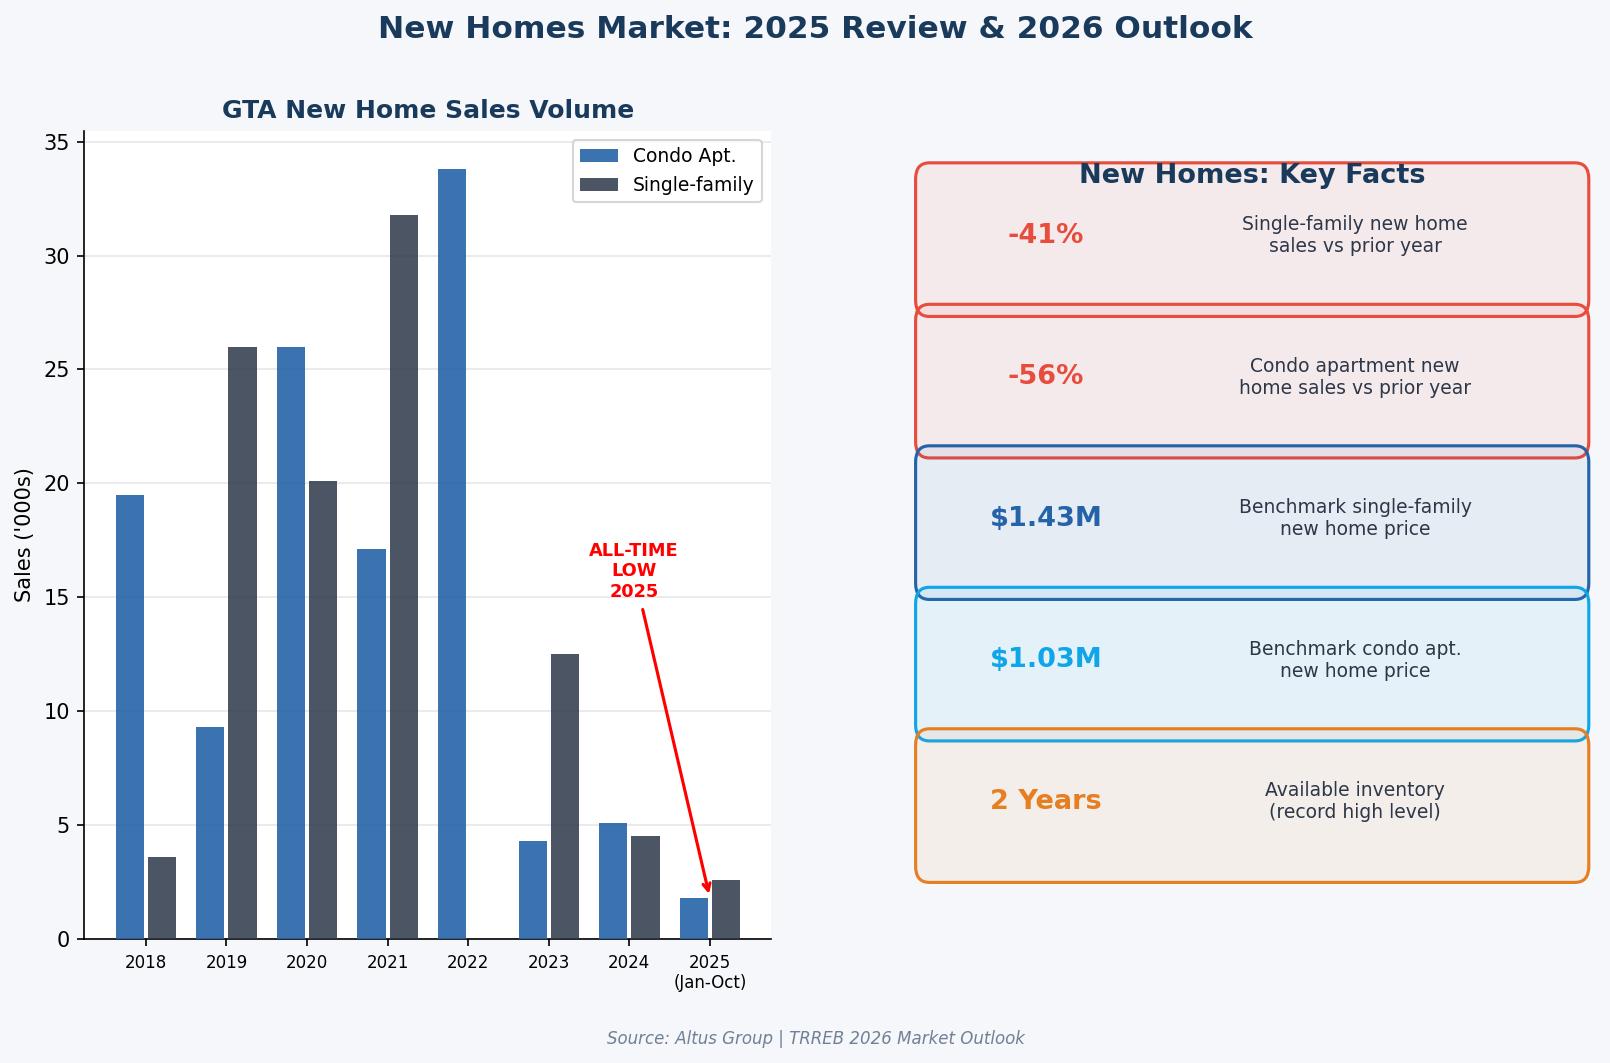
The analysis suggests a stark disparity between the GTA and competing regions like Calgary, where off-site levies averaged just $22,600 per unit. This cost-of-growth imbalance is a primary reason why new home sales slowed in 2025, as developers struggled to maintain project viability while buyers faced reduced purchasing power.
| Policy Measure | Effective Date | Target Demographic | Potential Savings |
| Federal GST Rebate | May 27, 2025 | First-Time Buyers (New Builds < $1M) | Up to $50,000 |
| Ontario HST Removal | Jan 1, 2026 | First-Time Buyers (New Builds < $1M) | Up to $80,000 |
| Middle-Class Tax Cut | 2025 Tax Year | Incomes below $173,000 | Up to $420/person |
| BoC Rate Cuts | Ongoing (2025) | All Borrowers | ~2.75% reduction in Prime |
Planning to buy your first home in 2026? (https://geraldlawrence.realtor/mortgagecalculator)
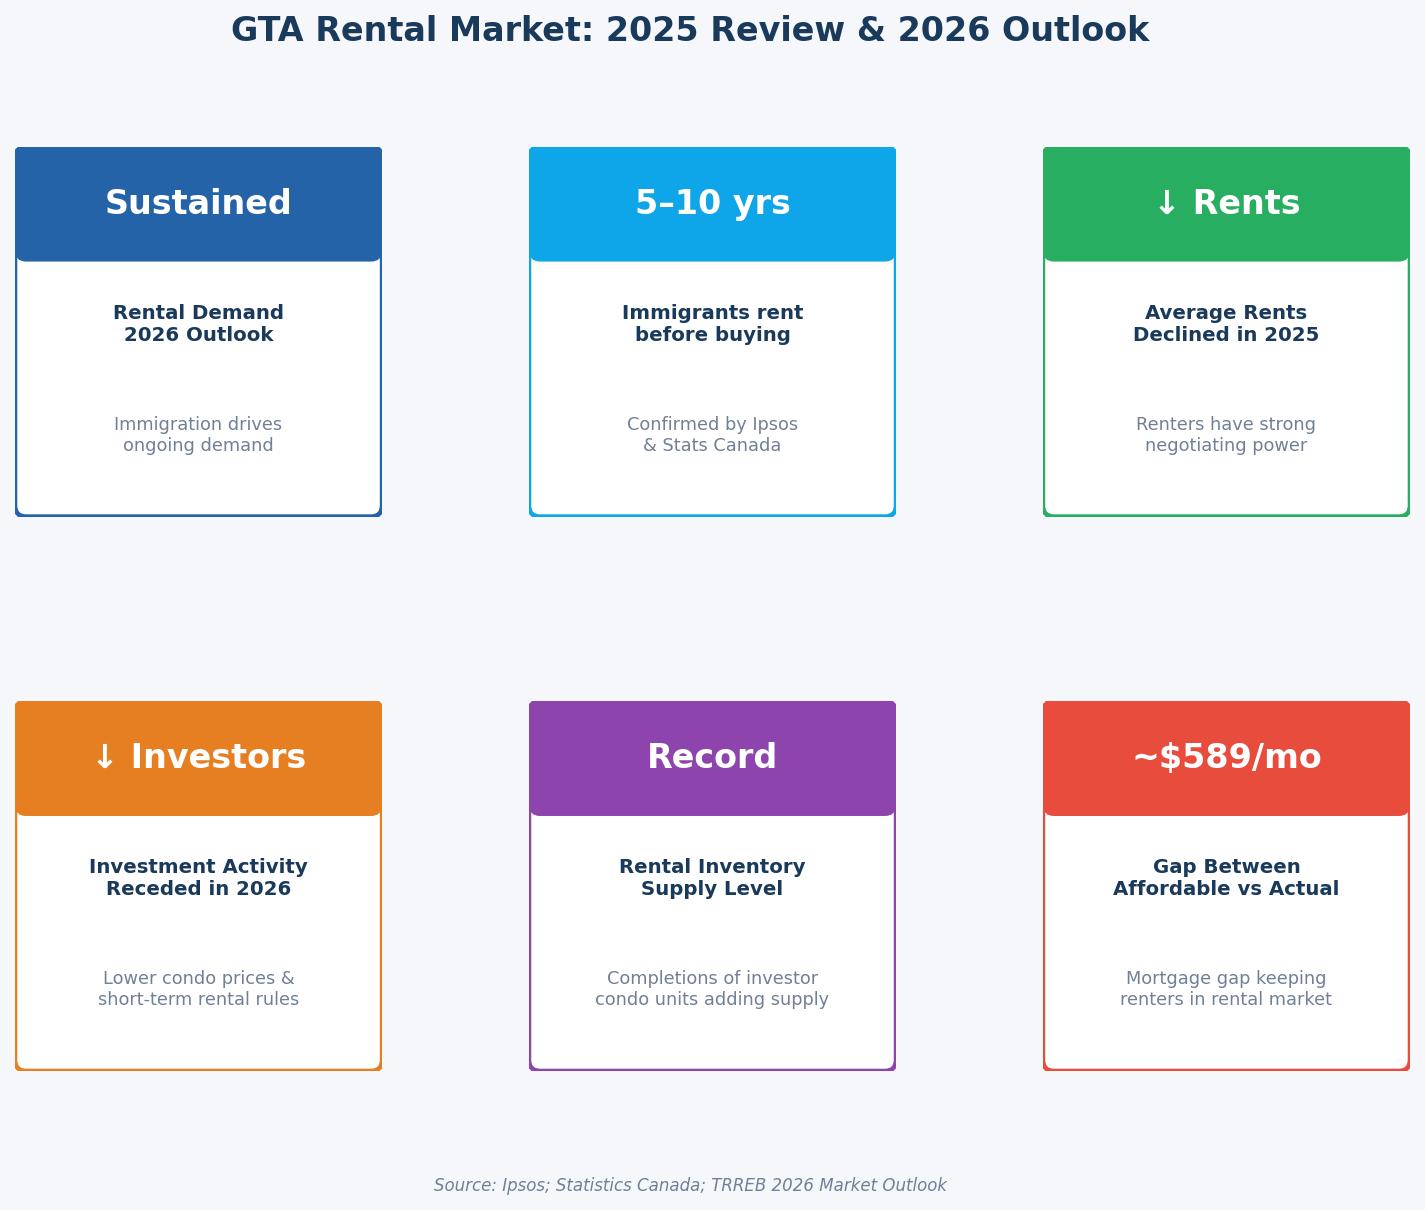
The Rental Market: A Shift in the Balance of Power
For several years, the GTA rental market had been defined by ultra-tight conditions and soaring rents. In 2025, that dynamic began to shift as supply growth met a cooling of demand.
The Vacancy Surge and the “Filtering Effect”
According to CMHC and TRREB reports, the national purpose-built rental vacancy rate rose to 3.1% in 2025, up from 2.2% in 2024. In the GTA, the rental inventory remained historically high due to a wave of condominium completions and the entry of new purpose-built rental units. This surge in supply created a “filtering effect.” As high-end, newly completed units hit the market, landlords were forced to offer incentives like one or two months of free rent to attract tenants. This, in turn, allowed tenants to move from older, less-efficient buildings into higher-quality units without the “rent shock” that had characterized previous moves.
Rental Prices and Negotiating Power
Average rents in the GTA trended lower on a year-over-year basis for the first time in the post-pandemic era. In the second quarter of 2025, average one-bedroom rents were down 5.1% to $2,326, while two-bedroom rents dropped 3.5% to $3,066. The inventory of units listed for rent grew by 16% year-over-year, significantly outpacing the growth in rental transactions. For the renter, this meant that the power dynamic had shifted from the landlord to the tenant. The evidence indicates that even in the secondary rental market (condo rentals), vacancies rose, and owners became more flexible on terms to avoid units sitting empty.
| Rental Segment (GTA) | Q2 2025 Avg Rent | Q2 2024 Avg Rent | YoY Change |
| Bachelor | $1,873 | $1,972 | -5.0% |
| 1-Bedroom | $2,326 | $2,452 | -5.1% |
| 2-Bedroom | $3,066 | $3,178 | -3.5% |
| 3-Bedroom | $3,924 | $3,972 | -1.2% |
The analysis highlights that while permanent residents through immigration helped keep transaction volumes above 2024 levels, the dip in temporary residents—students and temporary workers—removed a significant layer of competition from the bottom of the market.
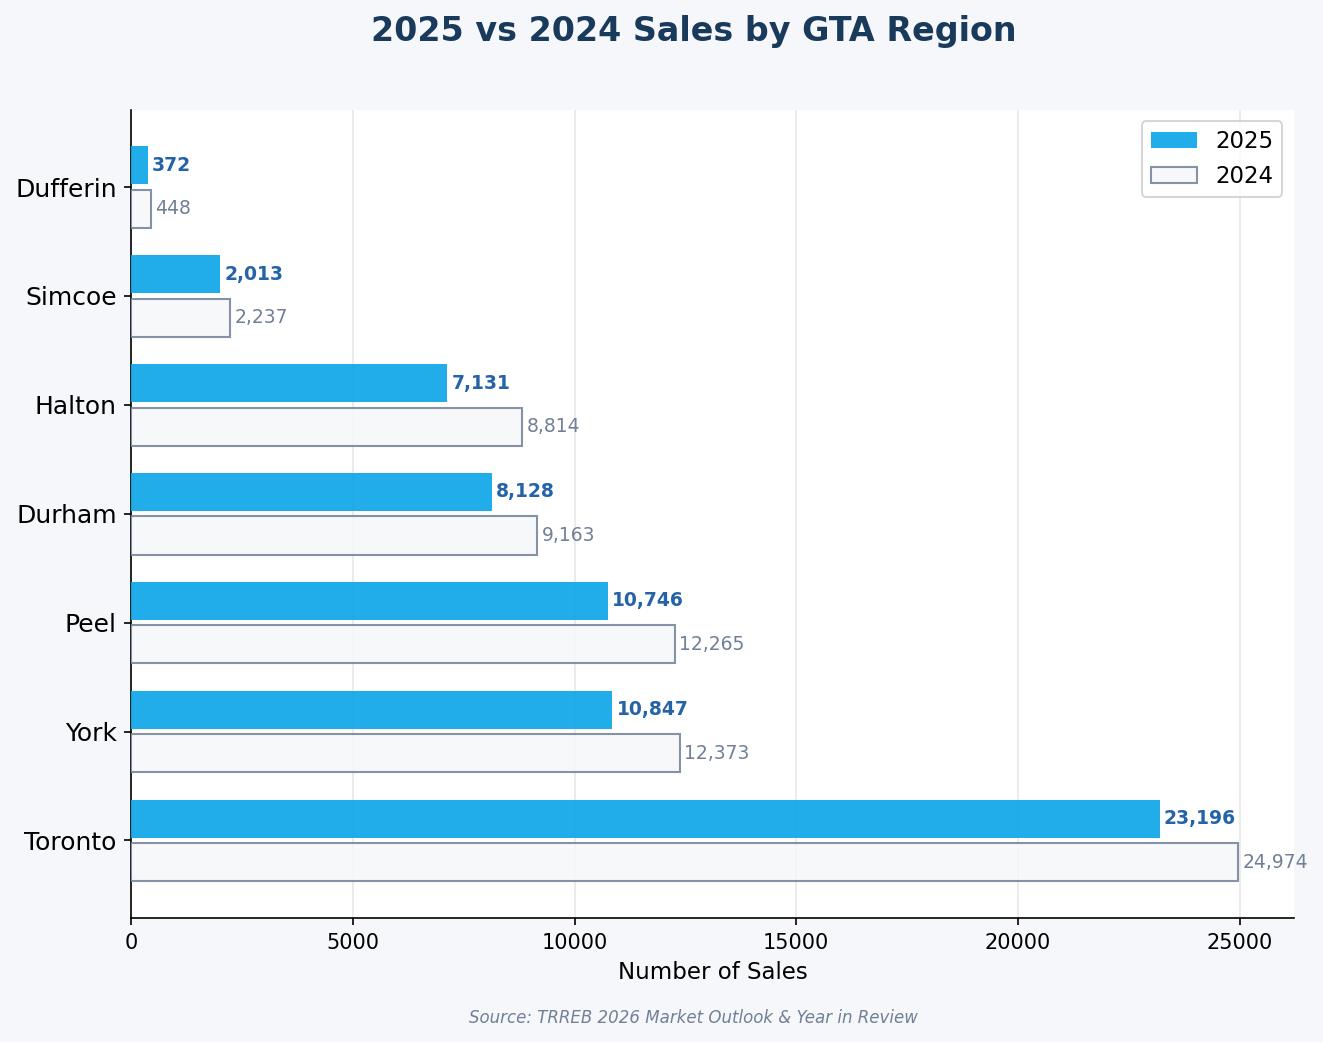
Regional Deep Dives: The Durham and Uxbridge Micro-Markets
While the broader GTA market felt the weight of 2025’s economic headwinds, certain pockets showed remarkable resilience and localized dynamism. The Durham Region, in particular, became a focus for families seeking the “missing middle” housing that was increasingly scarce in Toronto.
Durham Region: The Competitiveness Leader
In late 2025, Durham Region led the GTA in buyer competitiveness, boasting the lowest average days on market and a sale-price-to-list-price ratio that remained consistently near parity. Despite a 4.8% decrease in average sale prices year-over-year, detached homes in Durham remained stable, averaging just over $945,000 in October. The region’s attractiveness was driven by a combination of affordability and economic momentum. Durham achieved a record $1.23 billion in non-residential building permits in 2023, signaling a robust economic ecosystem that supports long-term property appreciation.
Uxbridge: A Case Study in Market Reset
Uxbridge Township, known for its rural charm and high-value detached homes, provided a clear snapshot of the “normalization” trend.
-
Year-End Prices: The average sale price in Uxbridge reached $1,190,682 in December 2025, a marginal 0.32% increase from December 2024.
-
The “Buyer’s Window”: In January 2026, the average price dipped to $996,667, marking the first time in years that the regional average fell below the $1 million threshold.
-
Inventory Shifts: Active listings in Uxbridge reached 77 in December, a 40% increase year-over-year, while the average days on market climbed to 64 days.
The data from Uxbridge suggests that while the “lifestyle-driven move” remains a priority for many, buyers are now moving at their own pace, performing due diligence, and negotiating terms that reflect the new interest rate reality.
Infrastructure: The Connectivity Catalyst
A critical “third-order” insight for property values in Durham and Uxbridge is the massive investment in transit connectivity.
-
Durham-Scarborough BRT: Ground was broken in 2025 on the 36-kilometer dedicated bus rapid transit lane, which is projected to reduce travel delays by 85% along the Kingston Road corridor.
-
Uxbridge Transit Hub: The upgrade of the local hub, integrating smart ticketing and real-time tracking, is scheduled to reduce travel times to Toronto by 20%, significantly enhancing the “commuter value” of homes in the township.
The professional perspective indicates that homes within walking distance of these hubs are positioned for superior long-term appreciation as the region continues to grow toward a projected population of 1.3 million by 2051.
Is your home near a future transit hub? Find out how infrastructure projects are impacting your property’s value.
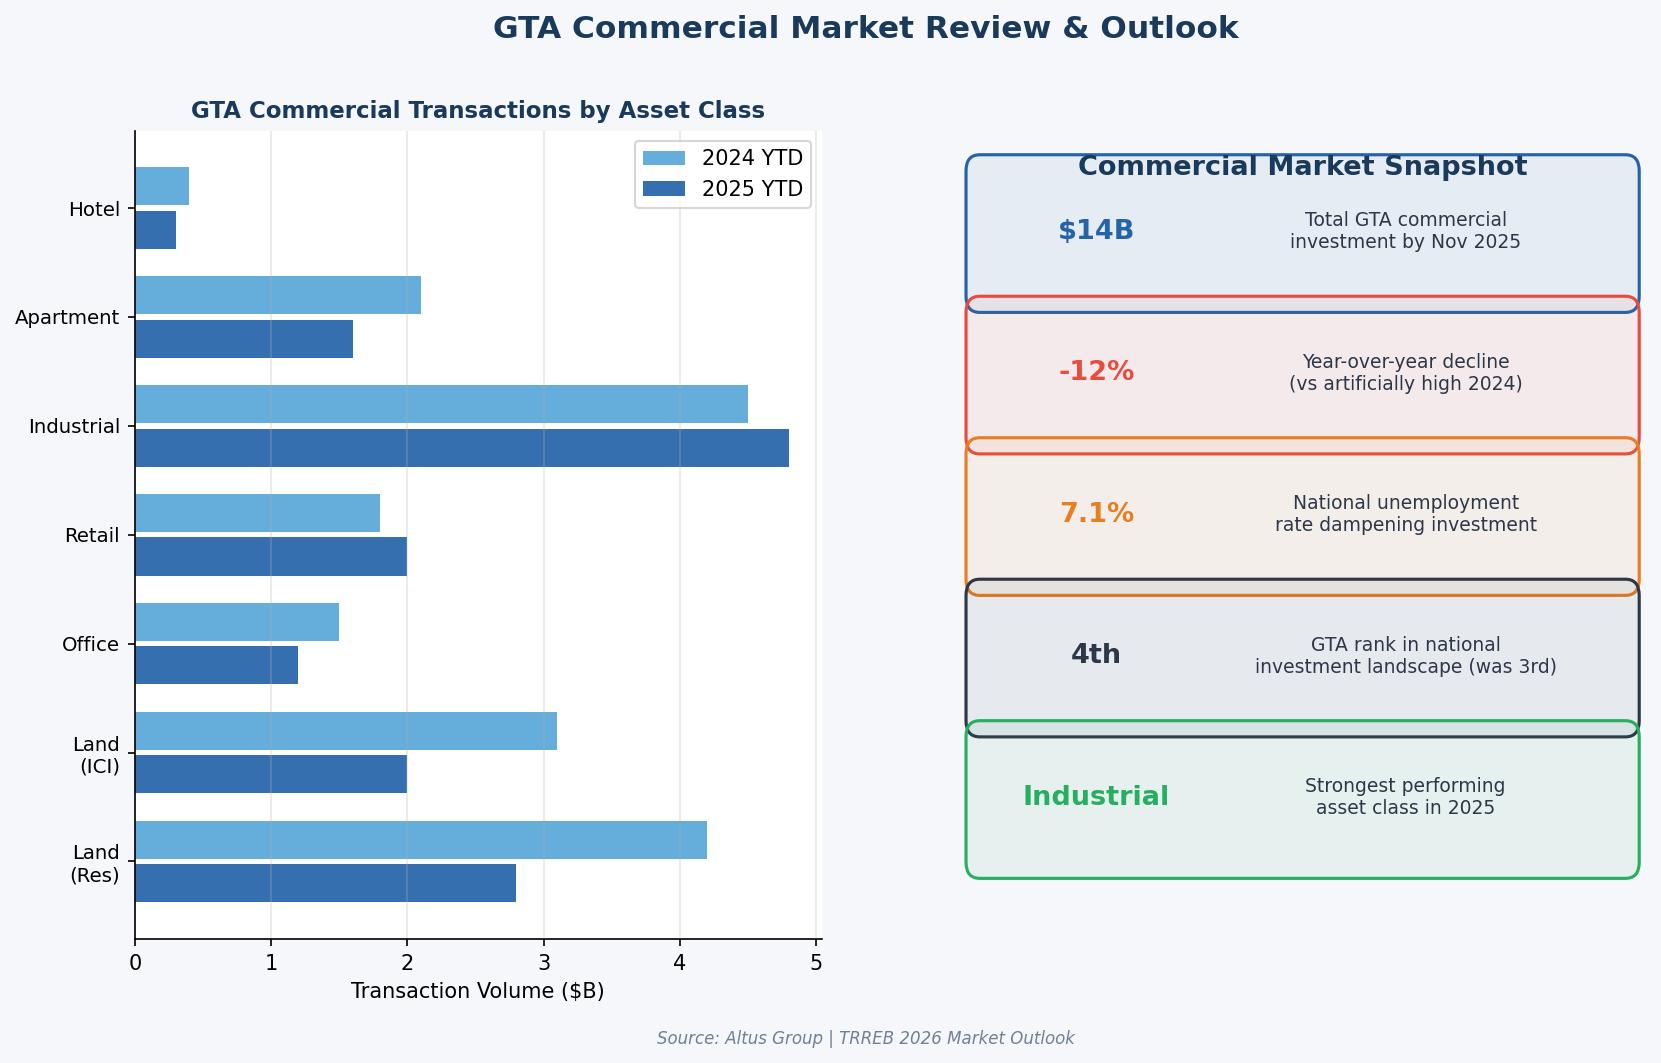
Commercial Real Estate: A Disciplined Holding Pattern
The GTA commercial real estate market in 2025 was a story of “mixed fortunes,” as optimism about improving debt markets clashed with persistent economic uncertainty. Total investment volume reached $2.9 billion in the third quarter, a 6% increase from the previous quarter but still 6% below 2024 levels.
Industrial Dominance
Industrial assets remained the undisputed leader of the commercial landscape, accounting for 51% of all transactions. Investment volume in this sector jumped 22% quarter-over-quarter, driven by a scarcity of high-quality assets. A standout transaction was a $152.5 million self-storage portfolio, which underscored the continued demand for logistical and storage solutions in an urbanizing GTA.
Office and Multi-Residential Challenges
Office investment remained the laggard, down 28% year-over-year. While improved leasing activity offered some hope, the sector continued to struggle with valuation uncertainty. Multi-residential investment also saw a sharp 62% decline from the previous year, although demand for value-add assets remained strong as financing conditions improved. The commercial sector in 2025 was defined by a “disciplined approach,” where investors were extremely selective, focusing on necessity-based assets like grocery-anchored strip malls, which saw a 49% resurgence in deal volume.
Conclusion: Synthesizing the 2025 Experience for the 2026 Horizon
The full year of 2025 represented the most significant structural rebalancing of the GTA real estate market since the 2008 financial crisis. For the first time in a decade, the “fear of missing out” was replaced by “the freedom of choice.” The analysis demonstrates that the 2025 market was not one of collapse, but of “normalization”—a reset that was necessary to create a sustainable foundation for future growth.
For Buyers, 2025 provided the strategic entry window they had been waiting for. More choice, less competition, and improved affordability through both lower mortgage rates and federal tax rebates created a rare moment of leverage. For Sellers, the year was a lesson in realism. Success required a departure from the emotional pricing of the past and a focus on presentation, strategy, and market-accurate valuations. For Renters, the year marked the end of the ultra-tight market. A wave of new supply and a cooling of demand granted them negotiating power and the ability to move into higher-quality housing with incentives.
As we look toward 2026, the evidence suggests that the “Pressure Point” identified by TRREB will remain a central theme. The region’s ability to retain talent and house its growing population depends on continued coordination across all levels of government to streamline development, reduce fees, and incentivize the “missing middle”. For the real estate professional, 2025 was the year we moved from speed to strategy, a shift that will define the winners of the next decade.
Professional Real Estate FAQ: 2025 Year in Review
Is the GTA real estate market currently in a buyer’s or seller’s market?
 In 2025, the GTA market shifted into a “balanced” state, with significant pockets of “buyer’s market” conditions, particularly in the condominium and entry-level freehold segments. Inventory reached levels not seen since 2009, granting buyers unprecedented power to include conditions and negotiate prices below list.
How much did home prices actually drop in 2025?
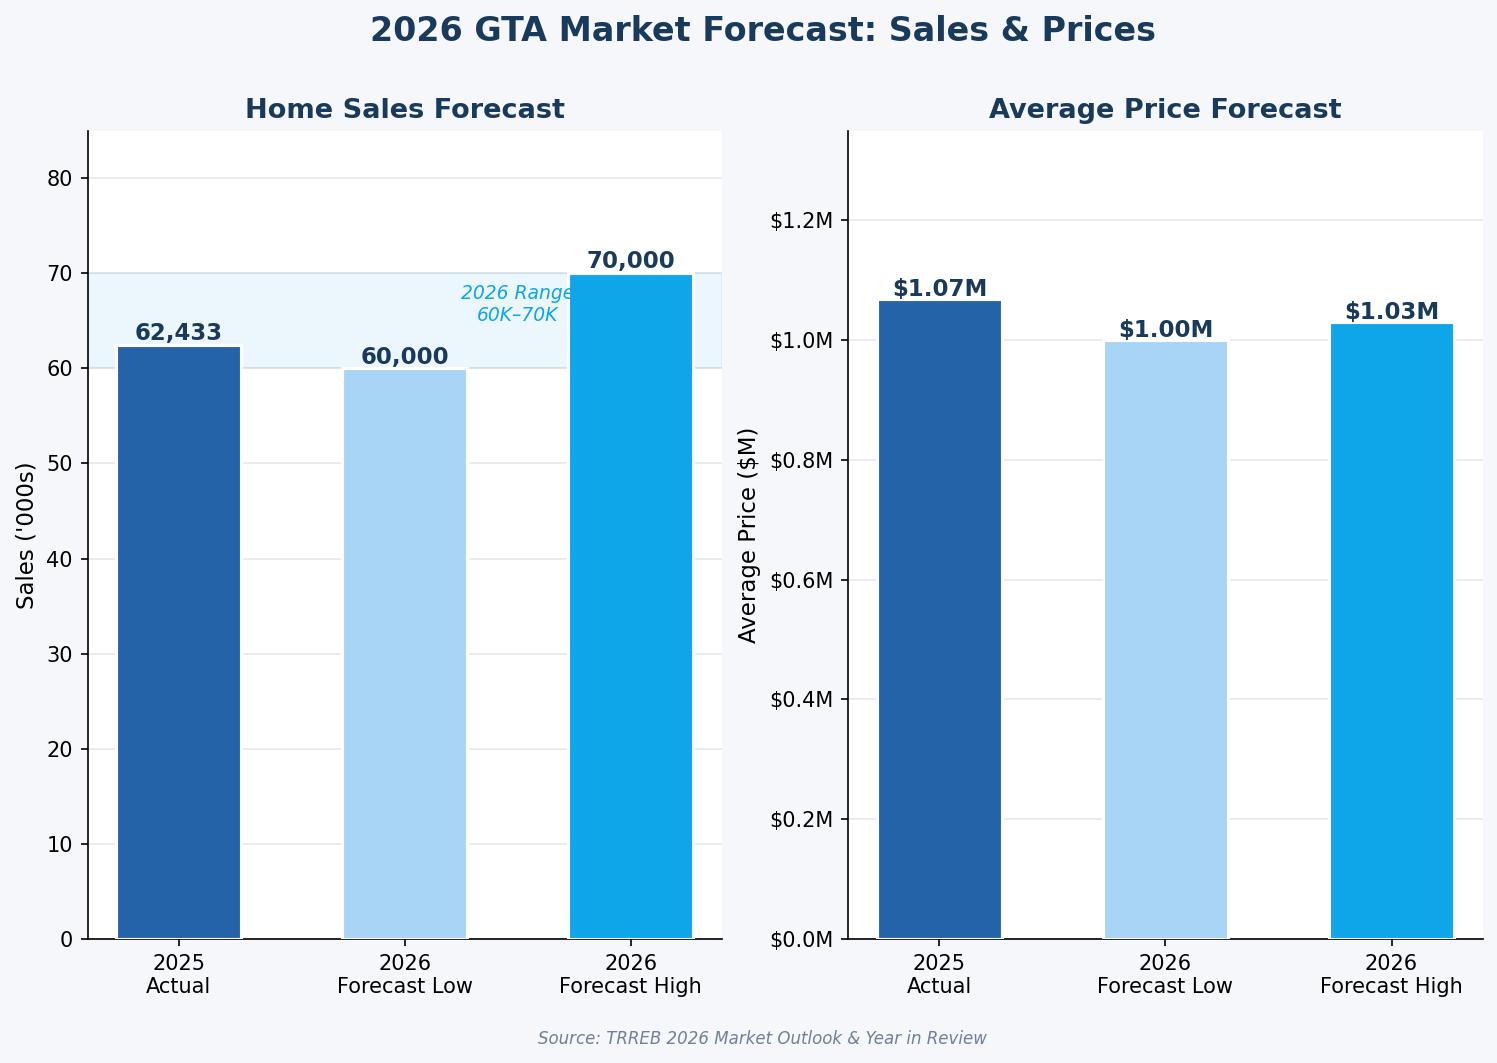
 Across the entire GTA, the average selling price for all home types in 2025 was approximately $1,067,968, a decrease of 4.7% from 2024. Detached homes saw the steepest correction at 5.2%, while the condo segment fell by 5.1% due to high inventory levels.
What is the new GST rebate for first-time buyers of new homes?
Introduced in the 2025 Federal Budget, the rebate eliminates the 5% GST for first-time buyers on newly built homes priced up to $1 million. A partial rebate is available for homes up to $1.5 million, providing up to $50,000 in total upfront savings for qualifying purchasers.
Why are so many people leaving the Greater Toronto Area (GTA)?
Outmigration is primarily driven by housing unaffordability, high property taxes, and extreme traffic congestion. Many young professionals and families are using remote work flexibility to relocate to more affordable regions like Alberta or Southwestern Ontario, where the cost of living and property taxes are significantly lower.
Are rents going down in Toronto and the GTA?
Yes, average rents trended lower in 2025 for the first time in several years. Average one-bedroom rents in the GTA fell by 5.1% to $2,326, as a surge in new condominium and purpose-built rental supply gave tenants more choice and negotiating power.
What impact did the multiplex zoning reform have on home values?
MIT research found that Toronto’s 2023 multiplex zoning reform led to a modest 1%-2% relative price increase for “larger lots” (30ft+ frontage). However, much of this value was “priced in” by the market during the policy discussion phase between 2021 and 2022.
How do development charges affect the price of new homes in Ontario?
Development charges in the GTA are among the highest in Canada, averaging $123,649 for a new low-rise home in 2025. These fees have increased by $42,000 since 2022, adding significant upward pressure on the final sale price of new housing supply.
Is now a good time to invest in the Toronto condo market?
The 2025 condo market offered unique opportunities for “value plays,” as high inventory and lower rents pressured some investors to sell. Strategic buyers are finding opportunities in well-located units where supply levels currently allow for deeper negotiations on price and terms.
Ready to make your move in 2026? (https://www.MultipleListings.ca)
