
 Facebook
 X
X
 Pinterest
 Copy Link

February 2026 Real Estate Market Update: A Season of Shift 🏡
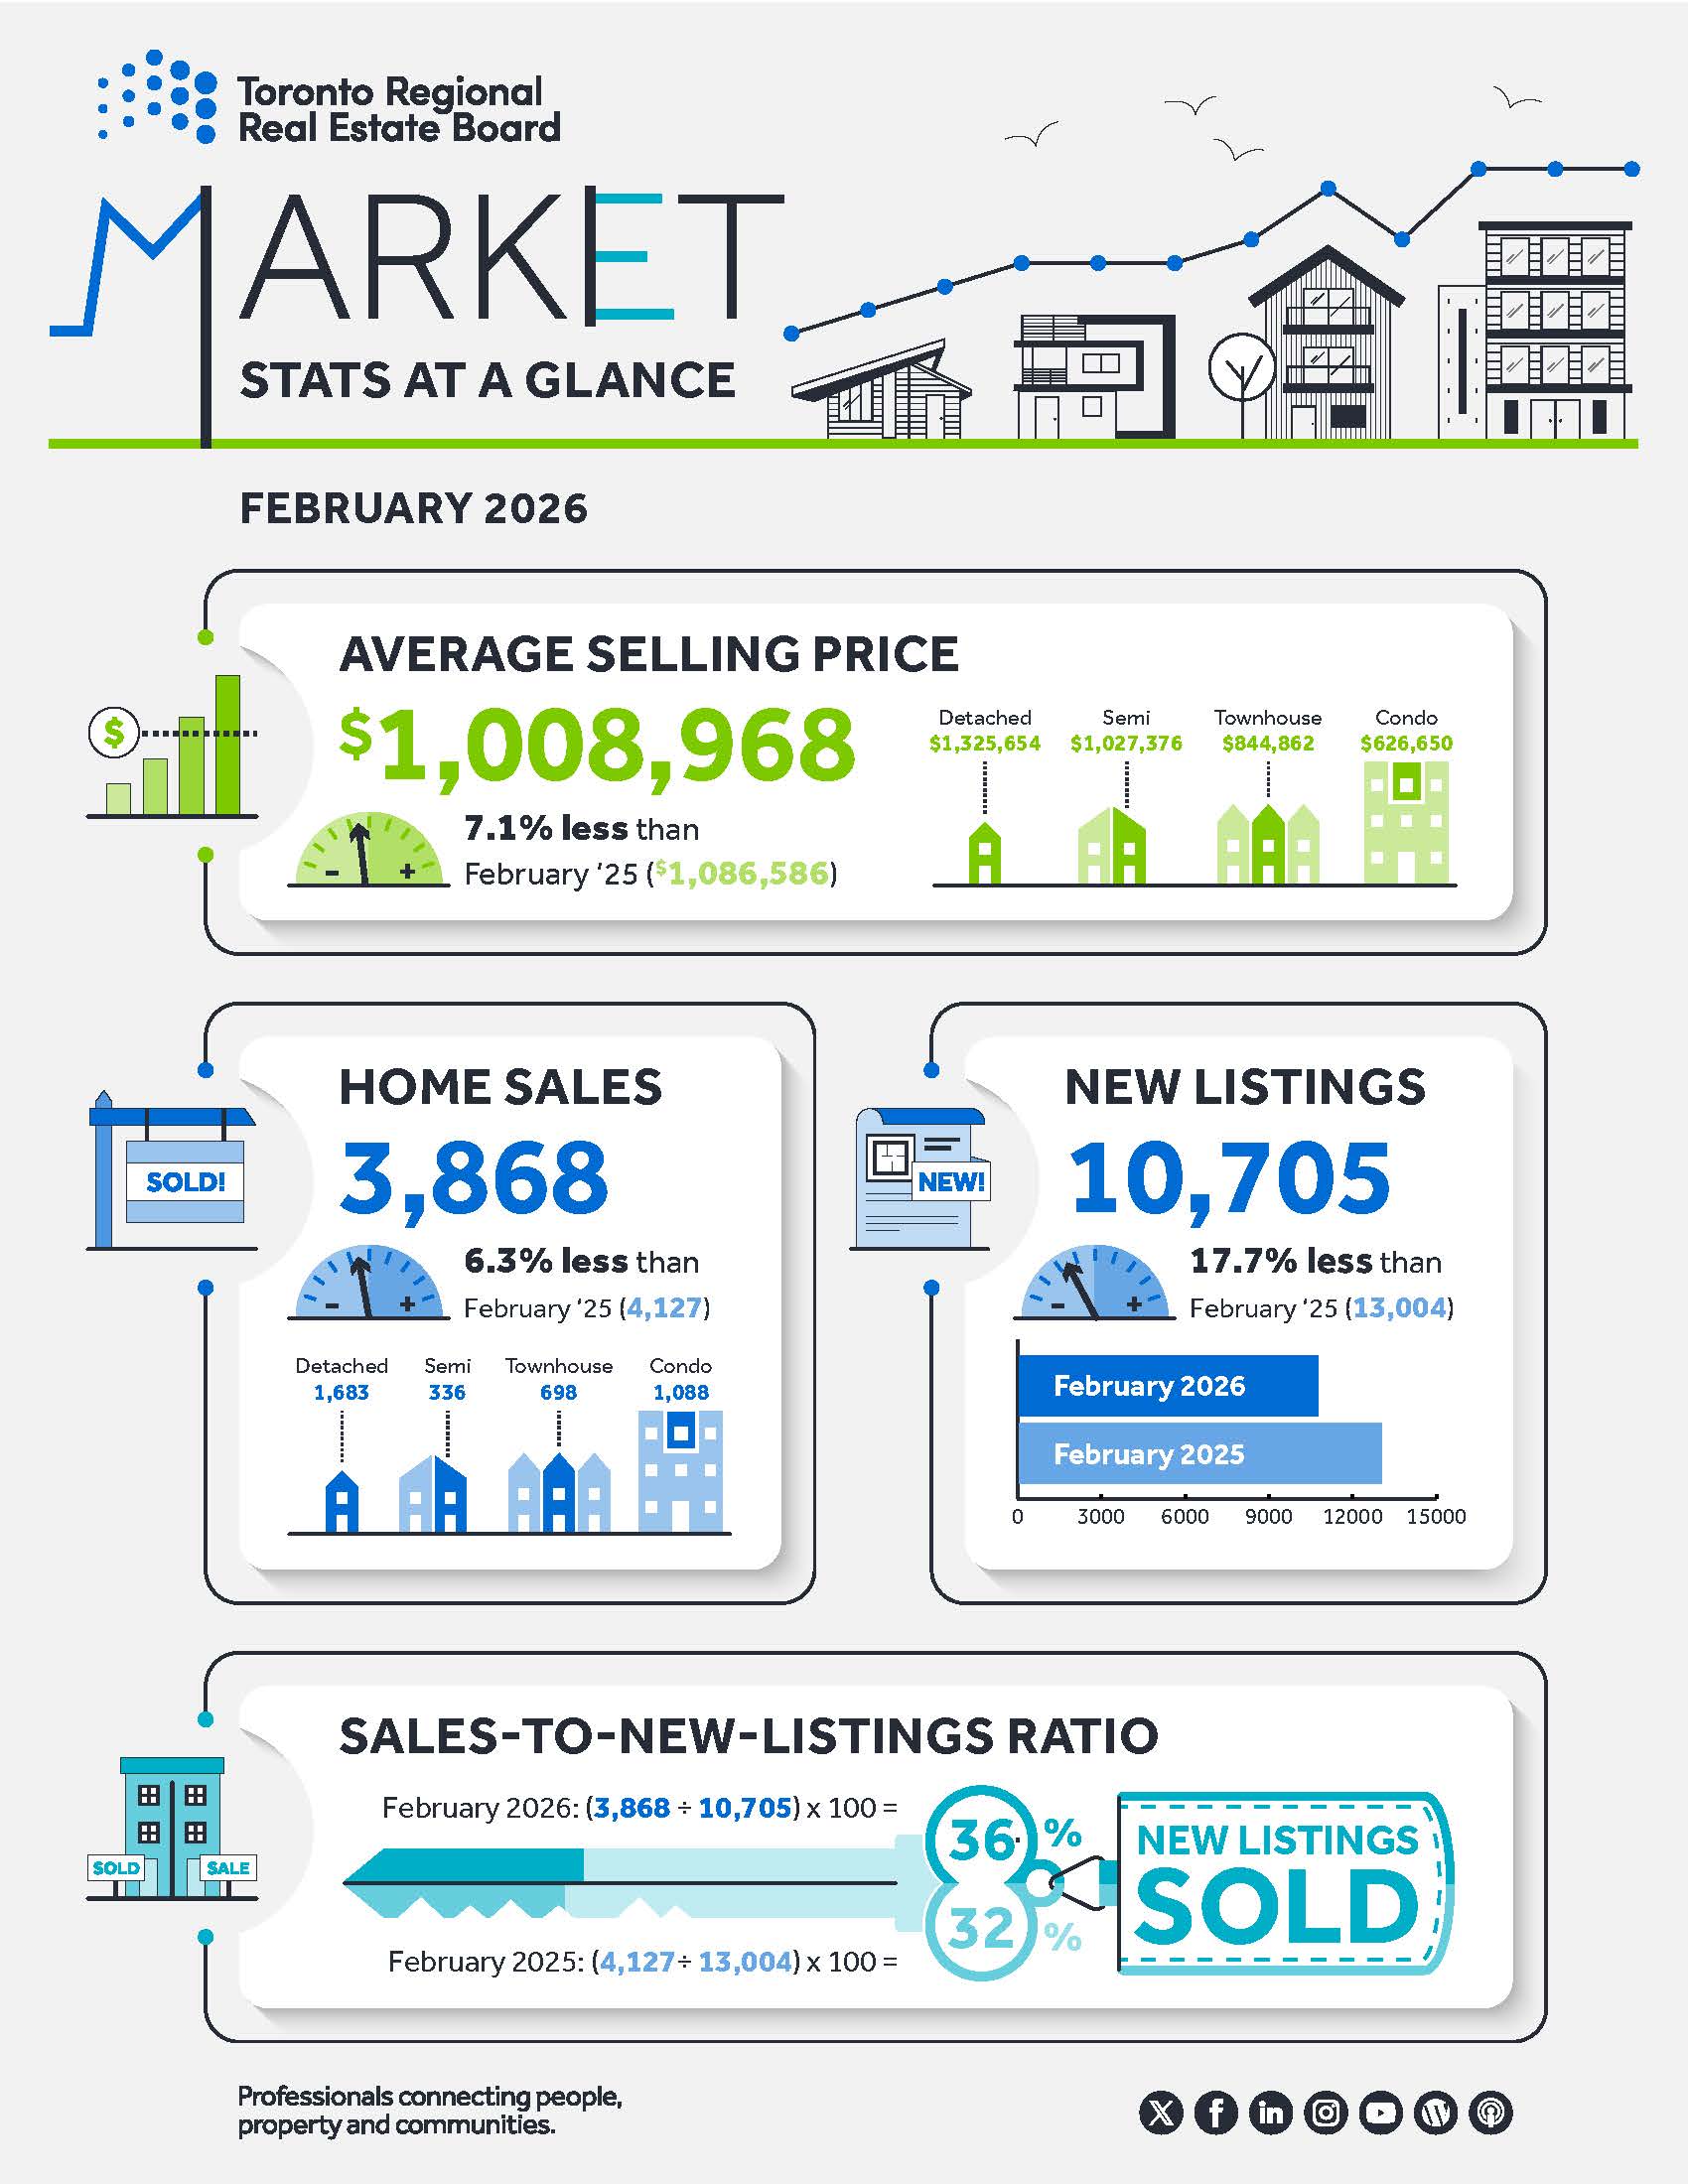
The Greater Toronto Area (GTA) resale housing market in February 2026 was characterized by tightening conditions, as a significant drop in new listings outpaced the decline in home sales. While overall sales volume decreased by 6.3% year-over-year, new listings saw a much sharper decline of 17.7%.
Wondering how the recent market shift has impacted your property’s bottom line? Get an instant update on your equity here: Free Home Evaluation 📈
Key Market Statistics
-
Average Selling Price: $1,008,968 (down 7.1% from February 2025).

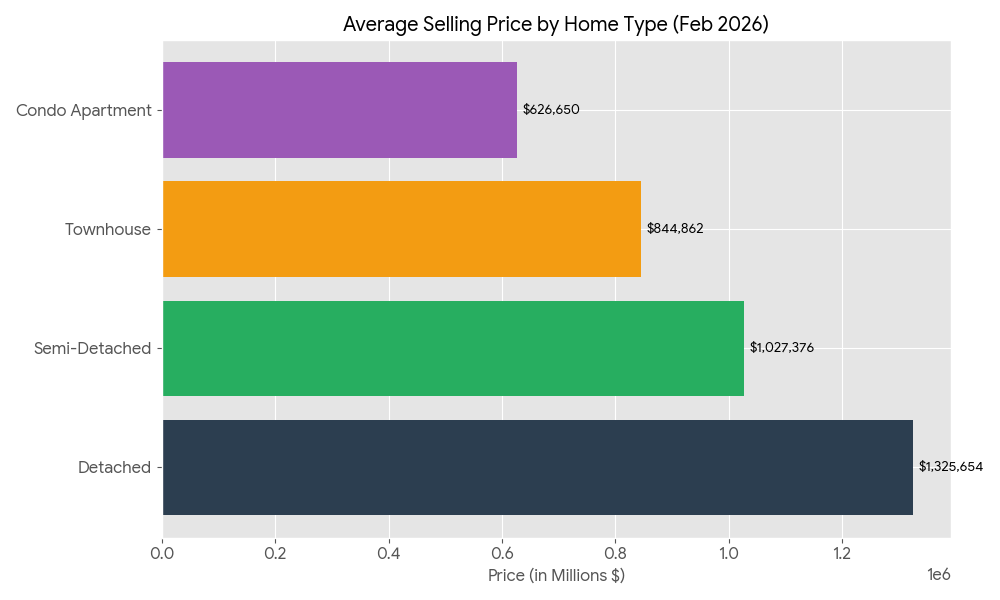
A quick-reference guide for your readers to see exactly where average prices landed in February 2026. It showcases the price hierarchy from Detached homes at $1,325,654 down to Condo Apartments at $626,650. This is an essential “anchor” visual for any market update.
Thinking of moving this spring? Step one is knowing your numbers. Start your journey with a FREE Professional Home Evaluation today! 🏠
-
Total Home Sales: 3,868 reported transactions.
-
New Listings: 10,705 properties entered the market.
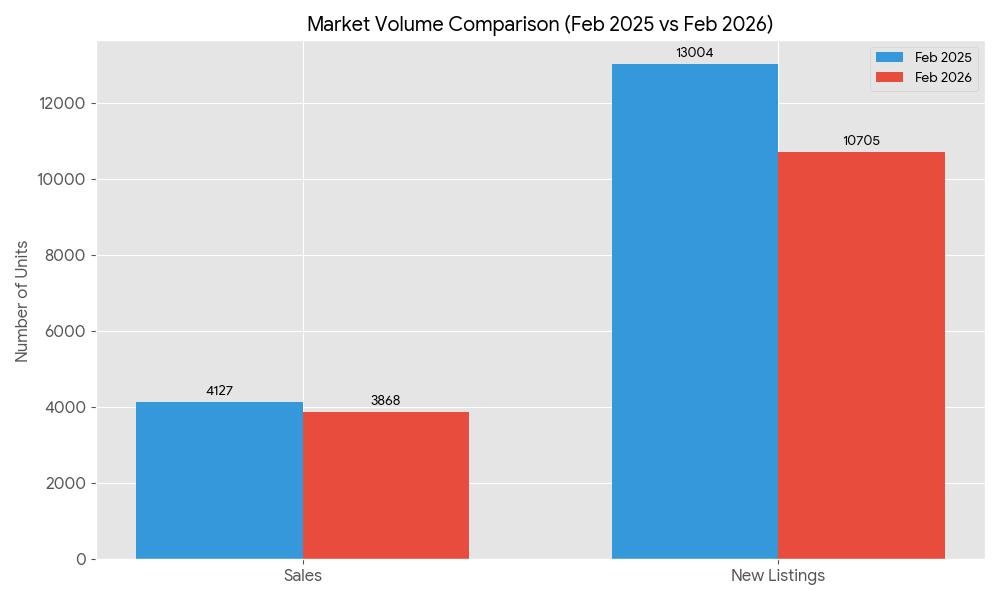
This chart highlights the most significant trend of the month: the massive drop in new supply. While sales dipped by 6.3% , new listings plummeted by 17.7%. This visual clearly shows that while the market is “slower,” the lack of inventory is actually tightening market conditions.
With new listings down 17.7%, your home has less competition than it did last year. See what your home is worth in today’s tight market: Quick Home Values ✨
-
Price Index: The MLS® Home Price Index (HPI) Composite benchmark dropped by 7.9% year-over-year.
- This chart focuses on the MLS® Home Price Index (HPI), which tracks the value of a “benchmark” home. I’ve highlighted the Durham Region specifically—with its 7.05% year-over-year dip , it is actually performing better (retaining more value) than the City of Toronto (-9.34%) or Peel Region (-9.58%).
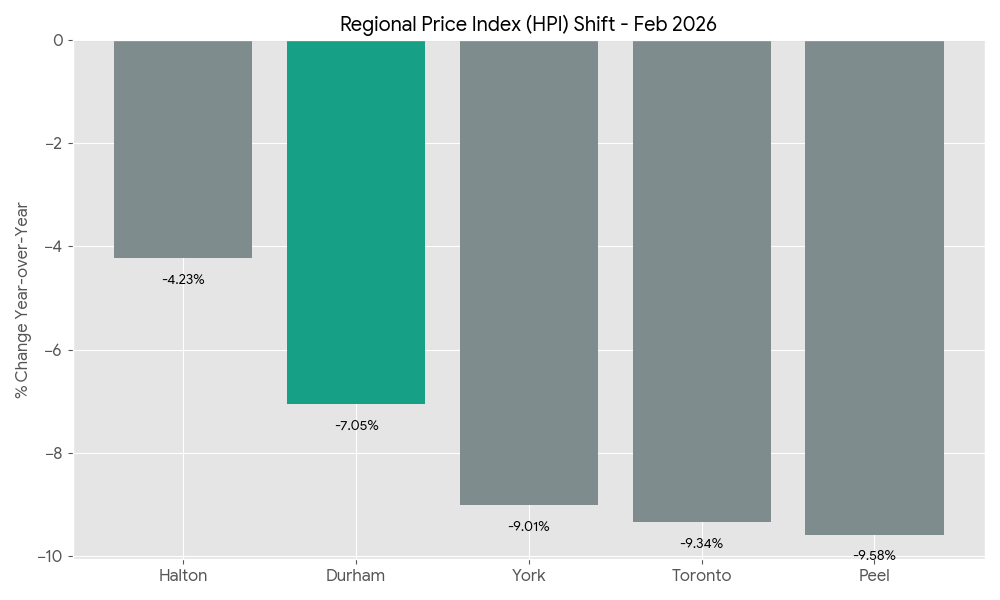
The Durham market is moving fast—don’t rely on old data. Get a real-time valuation of your home based on February’s latest sold prices: Click Here 🔍
Regional & Property Performance
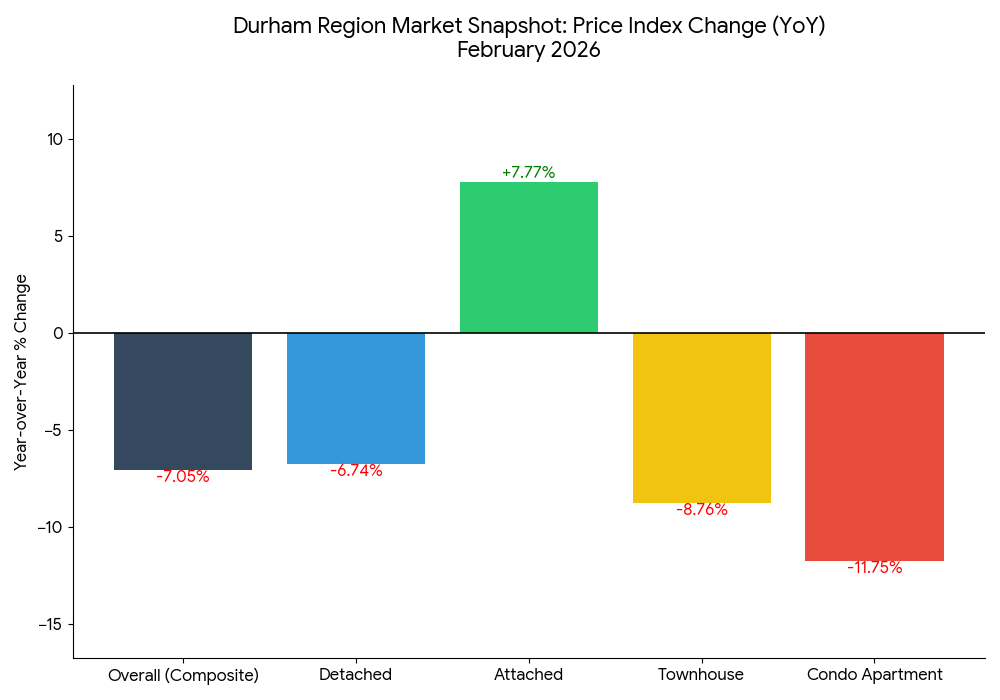
While the overall market is adjusting, Durham Region is showing some fascinating resilience in specific sectors. Here is the year-over-year price index change for February 2026:
-
Overall Market (Composite): Down 7.05%. with detached homes down 6.74% and apartments down 11.75%.
-
Detached Homes: Down 6.74%. Remained the most expensive segment with a GTA average of $1,325,654.
-
Single Family Attached: A surprising increase of 7.77%, showing strong demand for this specific segment.
-
Townhouses: Down 8.76%.
-
Condo Apartments: Saw the largest adjustment at -11.75%. Saw the largest volume of sales in the City of Toronto (733 sales) with a GTA-wide average price of $626,650.
TRREB analysts suggest that over 100,000 potential buyers are currently on the sidelines waiting for prices to stabilize and trade conditions to improve. If inventory levels remain low through the spring, increased competition is expected to drive a recovery in both sales and prices during the second half of 2026
With over 100,000 buyers currently waiting on the sidelines, now is the time to beat the rush. Secure your spot in the market today: Search Homes Now 🏃♂️
The latest figures from the Toronto Regional Real Estate Board (TRREB) are in for February 2026, and the data reveals a market that is undergoing a notable recalibration. While the pace of activity has softened compared to last year, the tightening of inventory is creating a unique dynamic for both buyers and sellers.
Is 2026 your year to sell? With experts predicting a surge in the second half of the year, find out your starting point now: Free Evaluation ⏳
The Big Picture: Sales and Pricing Trends
The headline story this month is a pull-back in overall volume. Home sales across the region totaled 3,868, representing a 6.3% decrease compared to the 4,127 sales recorded in February 2025.
This cooling trend is also reflected in property values. The average selling price for a home now sits at $1,008,968. This is a 7.1% dip from the February 2025 average of $1,086,586. For savvy buyers, this price adjustment may offer a strategic window of opportunity that wasn’t available during the peaks of the previous year.
Average prices have adjusted by 7.1% compared to last year. Find the best deals in your favorite neighborhood before they’re gone: View Current Listings 📉
Breakdown by Property Type
Understanding the market means looking at the specific segments where you live and shop. Here is how the average prices and sales volume shook out this February:
| Property Type | Average Selling Price | Total Sales Volume |
| Detached |
$1,325,654 |
1,683 Sales |
| Semi-Detached |
$1,027,376 |
336 Sales |
| Townhouse |
$844,862 |
698 Sales |
| Condo Apartment |
$626,650 |
1,088 Sales |
Don’t let low inventory stop you! New listings are hitting the market every day. Browse the freshest Durham Region homes for sale right here: Start Your Search 🕵️♂️
The Inventory Crunch: New Listings on the Rise?
Perhaps the most significant statistic this month is the sharp decline in new inventory. There were only 10,705 new listings brought to market in February, a substantial 17.7% drop from the 13,004 listings seen in the same month last year.
This scarcity of new options is a critical factor for anyone planning a move. With fewer homes entering the market, competition for well-priced, high-quality listings remains steady.
Looking for a detached home or a sleek condo? Filter your search by property type and price to find your perfect match: Custom Home Search 🏢
Understanding Market Tightness: Sales-to-New-Listings
The Sales-to-New-Listings Ratio (SNLR) is a key indicator used to determine if we are in a “Buyer’s,” “Seller’s,” or “Balanced” market.
-
February 2026: 36%
-
February 2025: 32%
Interestingly, even though total sales are down, the ratio has actually increased to 36%. This means that while fewer people are buying, even fewer people are selling, which effectively keeps the market from swinging too far into “Buyer’s Market” territory.
Your next chapter starts with a single click. Explore every active listing in the GTA and Durham Region on my easy-to-use portal: GeraldLawrence.Realtor/Search 🥂
What This Means for You
-
For Sellers: Low inventory is your greatest ally. With 17.7% fewer homes to compete against, your property has a better chance of standing out, provided it is priced correctly for the current $1M+ average environment.
-
For Buyers: The 7.1% decrease in average price is a welcome relief. However, with fewer new listings hitting the wire, you’ll need to be decisive and have your financing in order to move quickly when the right home appears.

The real estate market inside scoop for the community you love. See homes that are for sale and have recently sold. Find out if home sales in your neighbourhood are trending up or down. See what homes around you are currently selling for.
