Facebook
 X
X
 Pinterest
 Copy Link


 The spring market has officially arrived. In the real estate world, March is often the “bellwether” month—the period that sets the tone for the remainder of the year. The March 2026 data reveals a market defined by increased velocity, high inventory turnover, and a notable shift in buyer-seller leverage.

If you are navigating the current landscape, these numbers aren’t just statistics; they are the roadmap to your next big financial decision.
1. Price Analysis: The “Correction” Continues
While we saw a modest uptick in prices from February to March, the Year-over-Year (YoY) and Year-to-Date (YTD) figures show a cooling trend that is actually providing much-needed stability to the market.
Breaking Down the Numbers
-
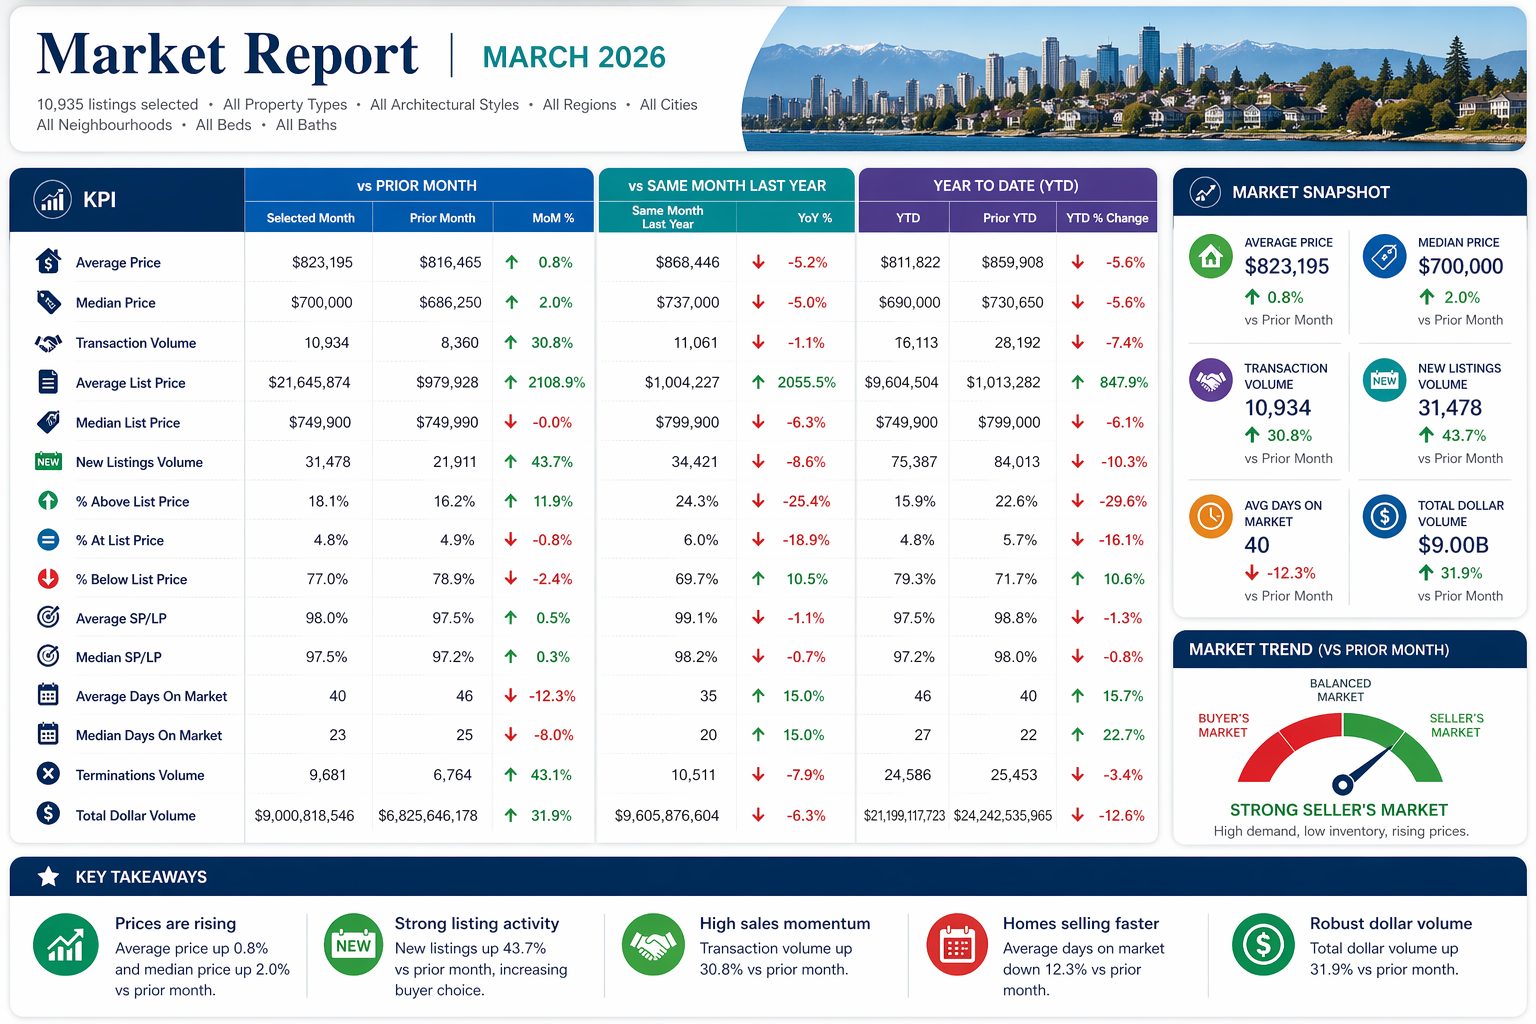
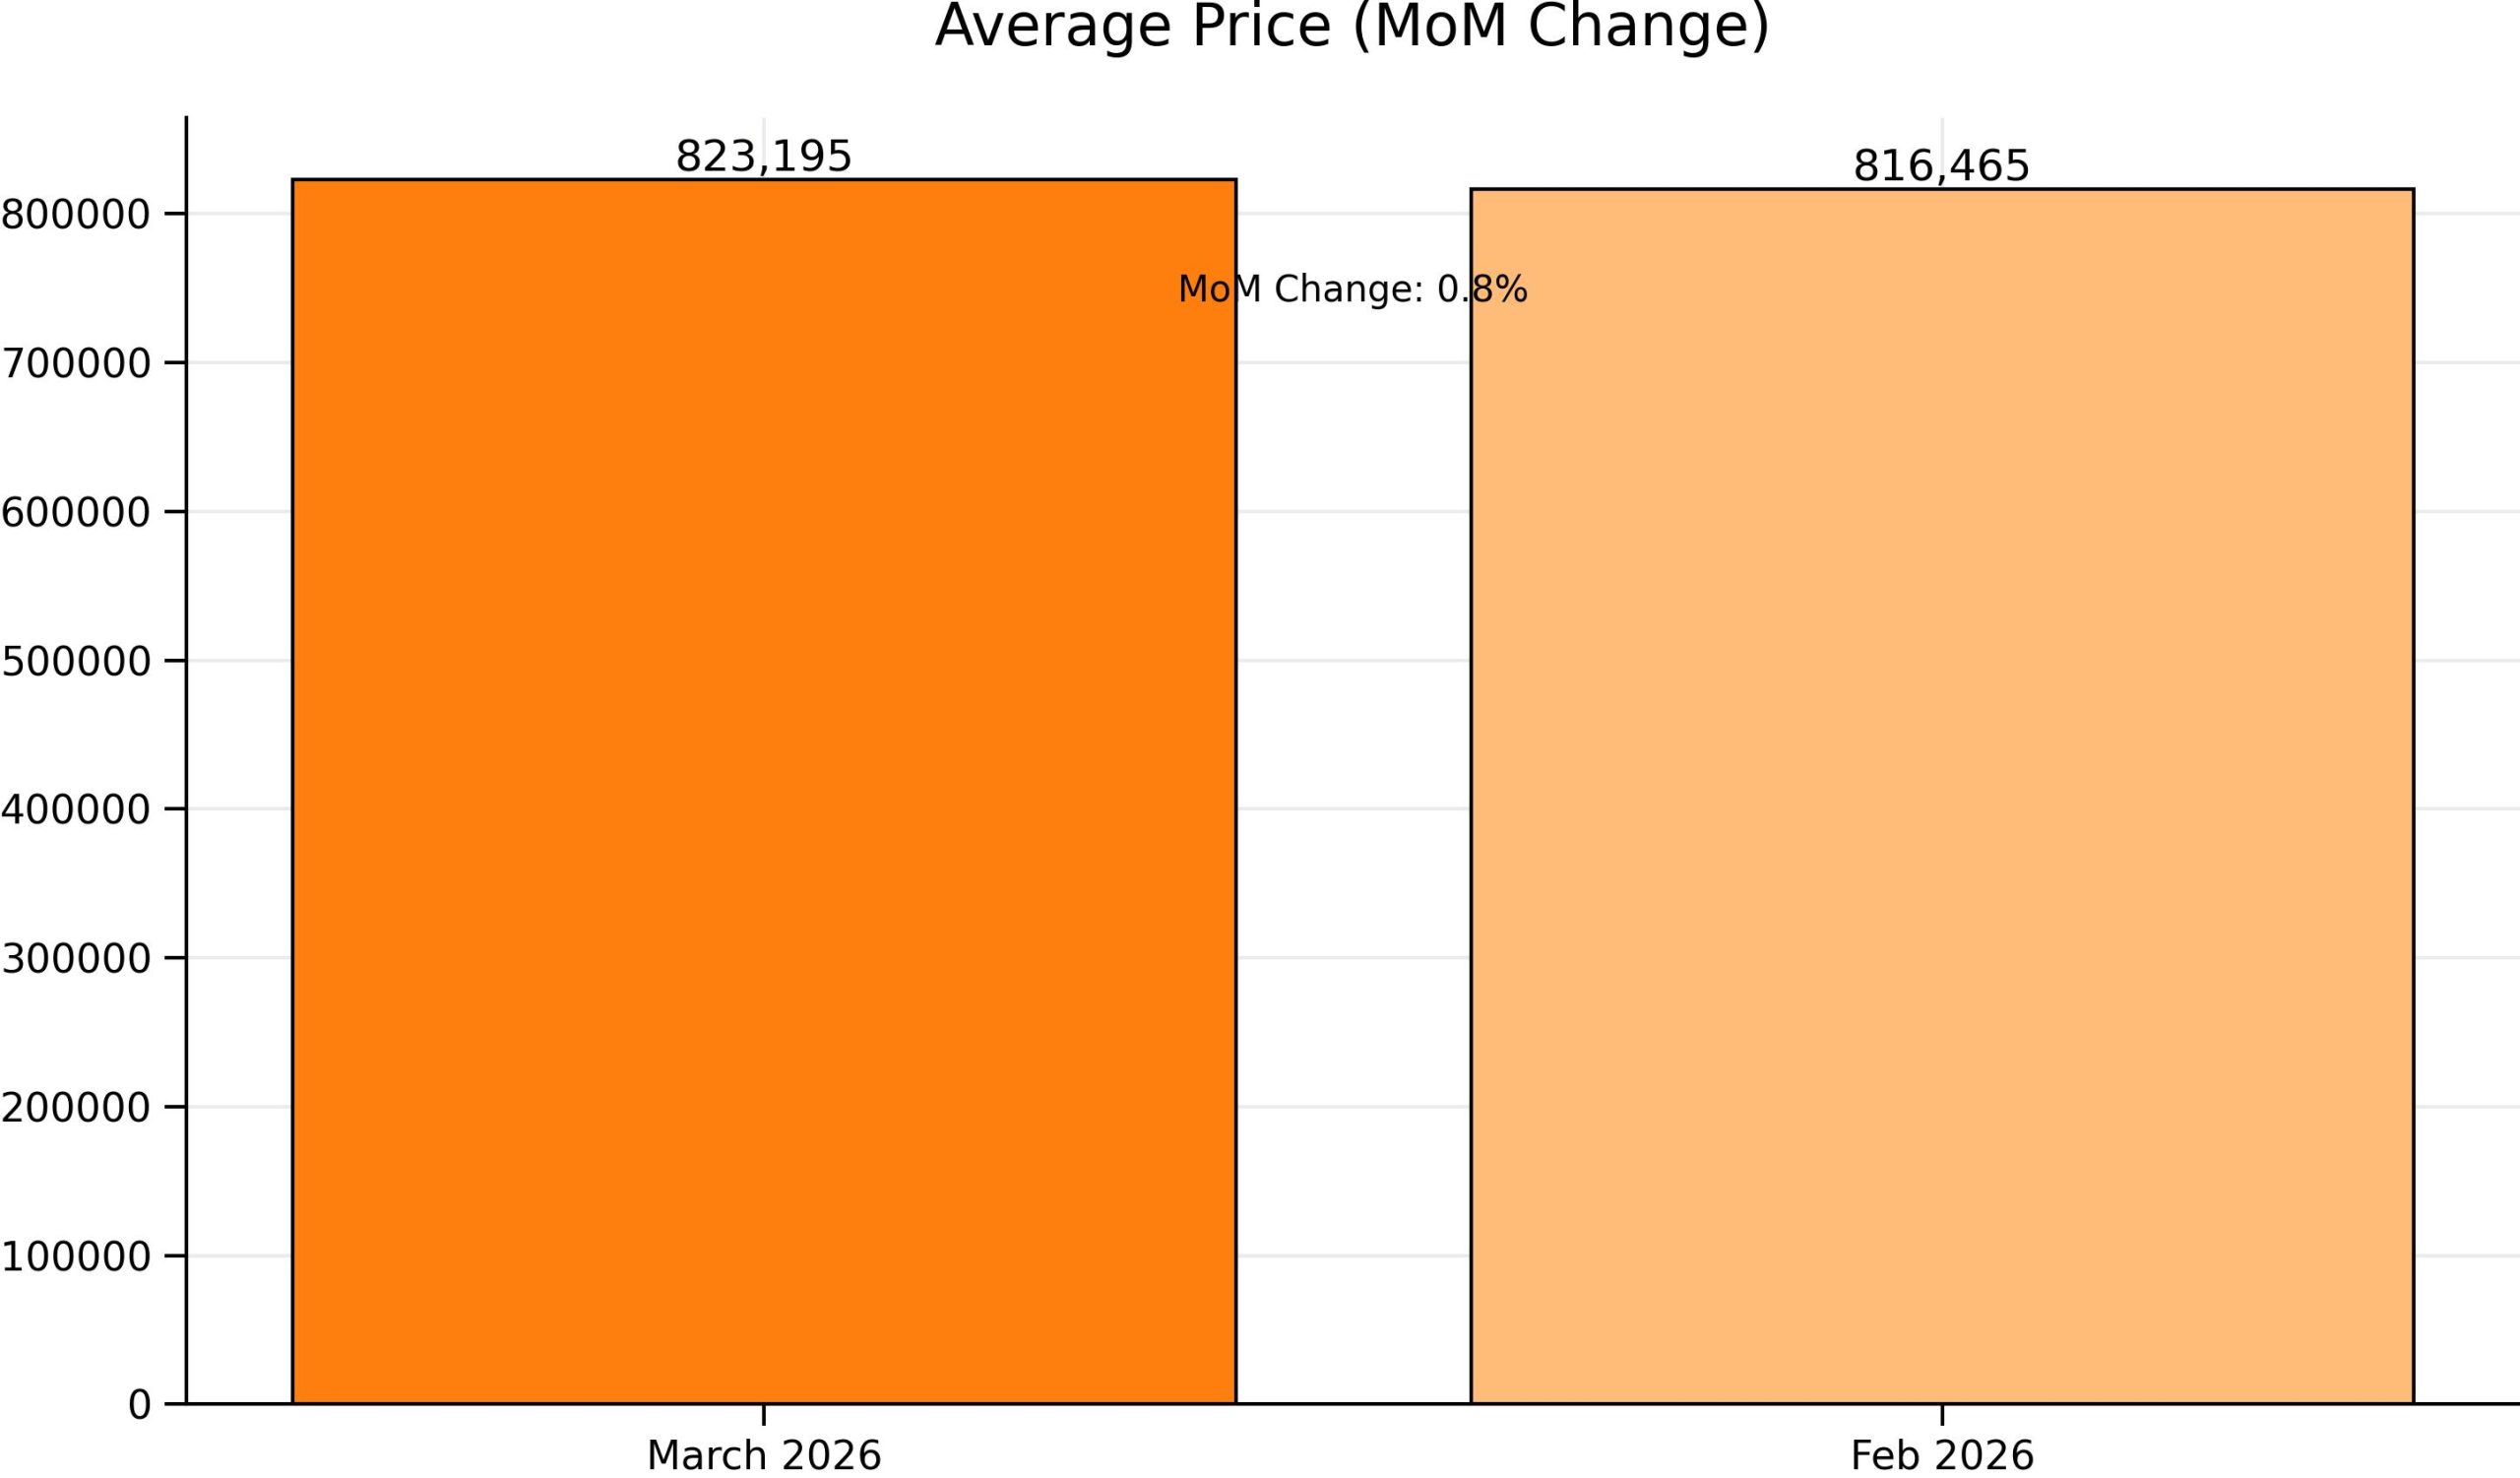
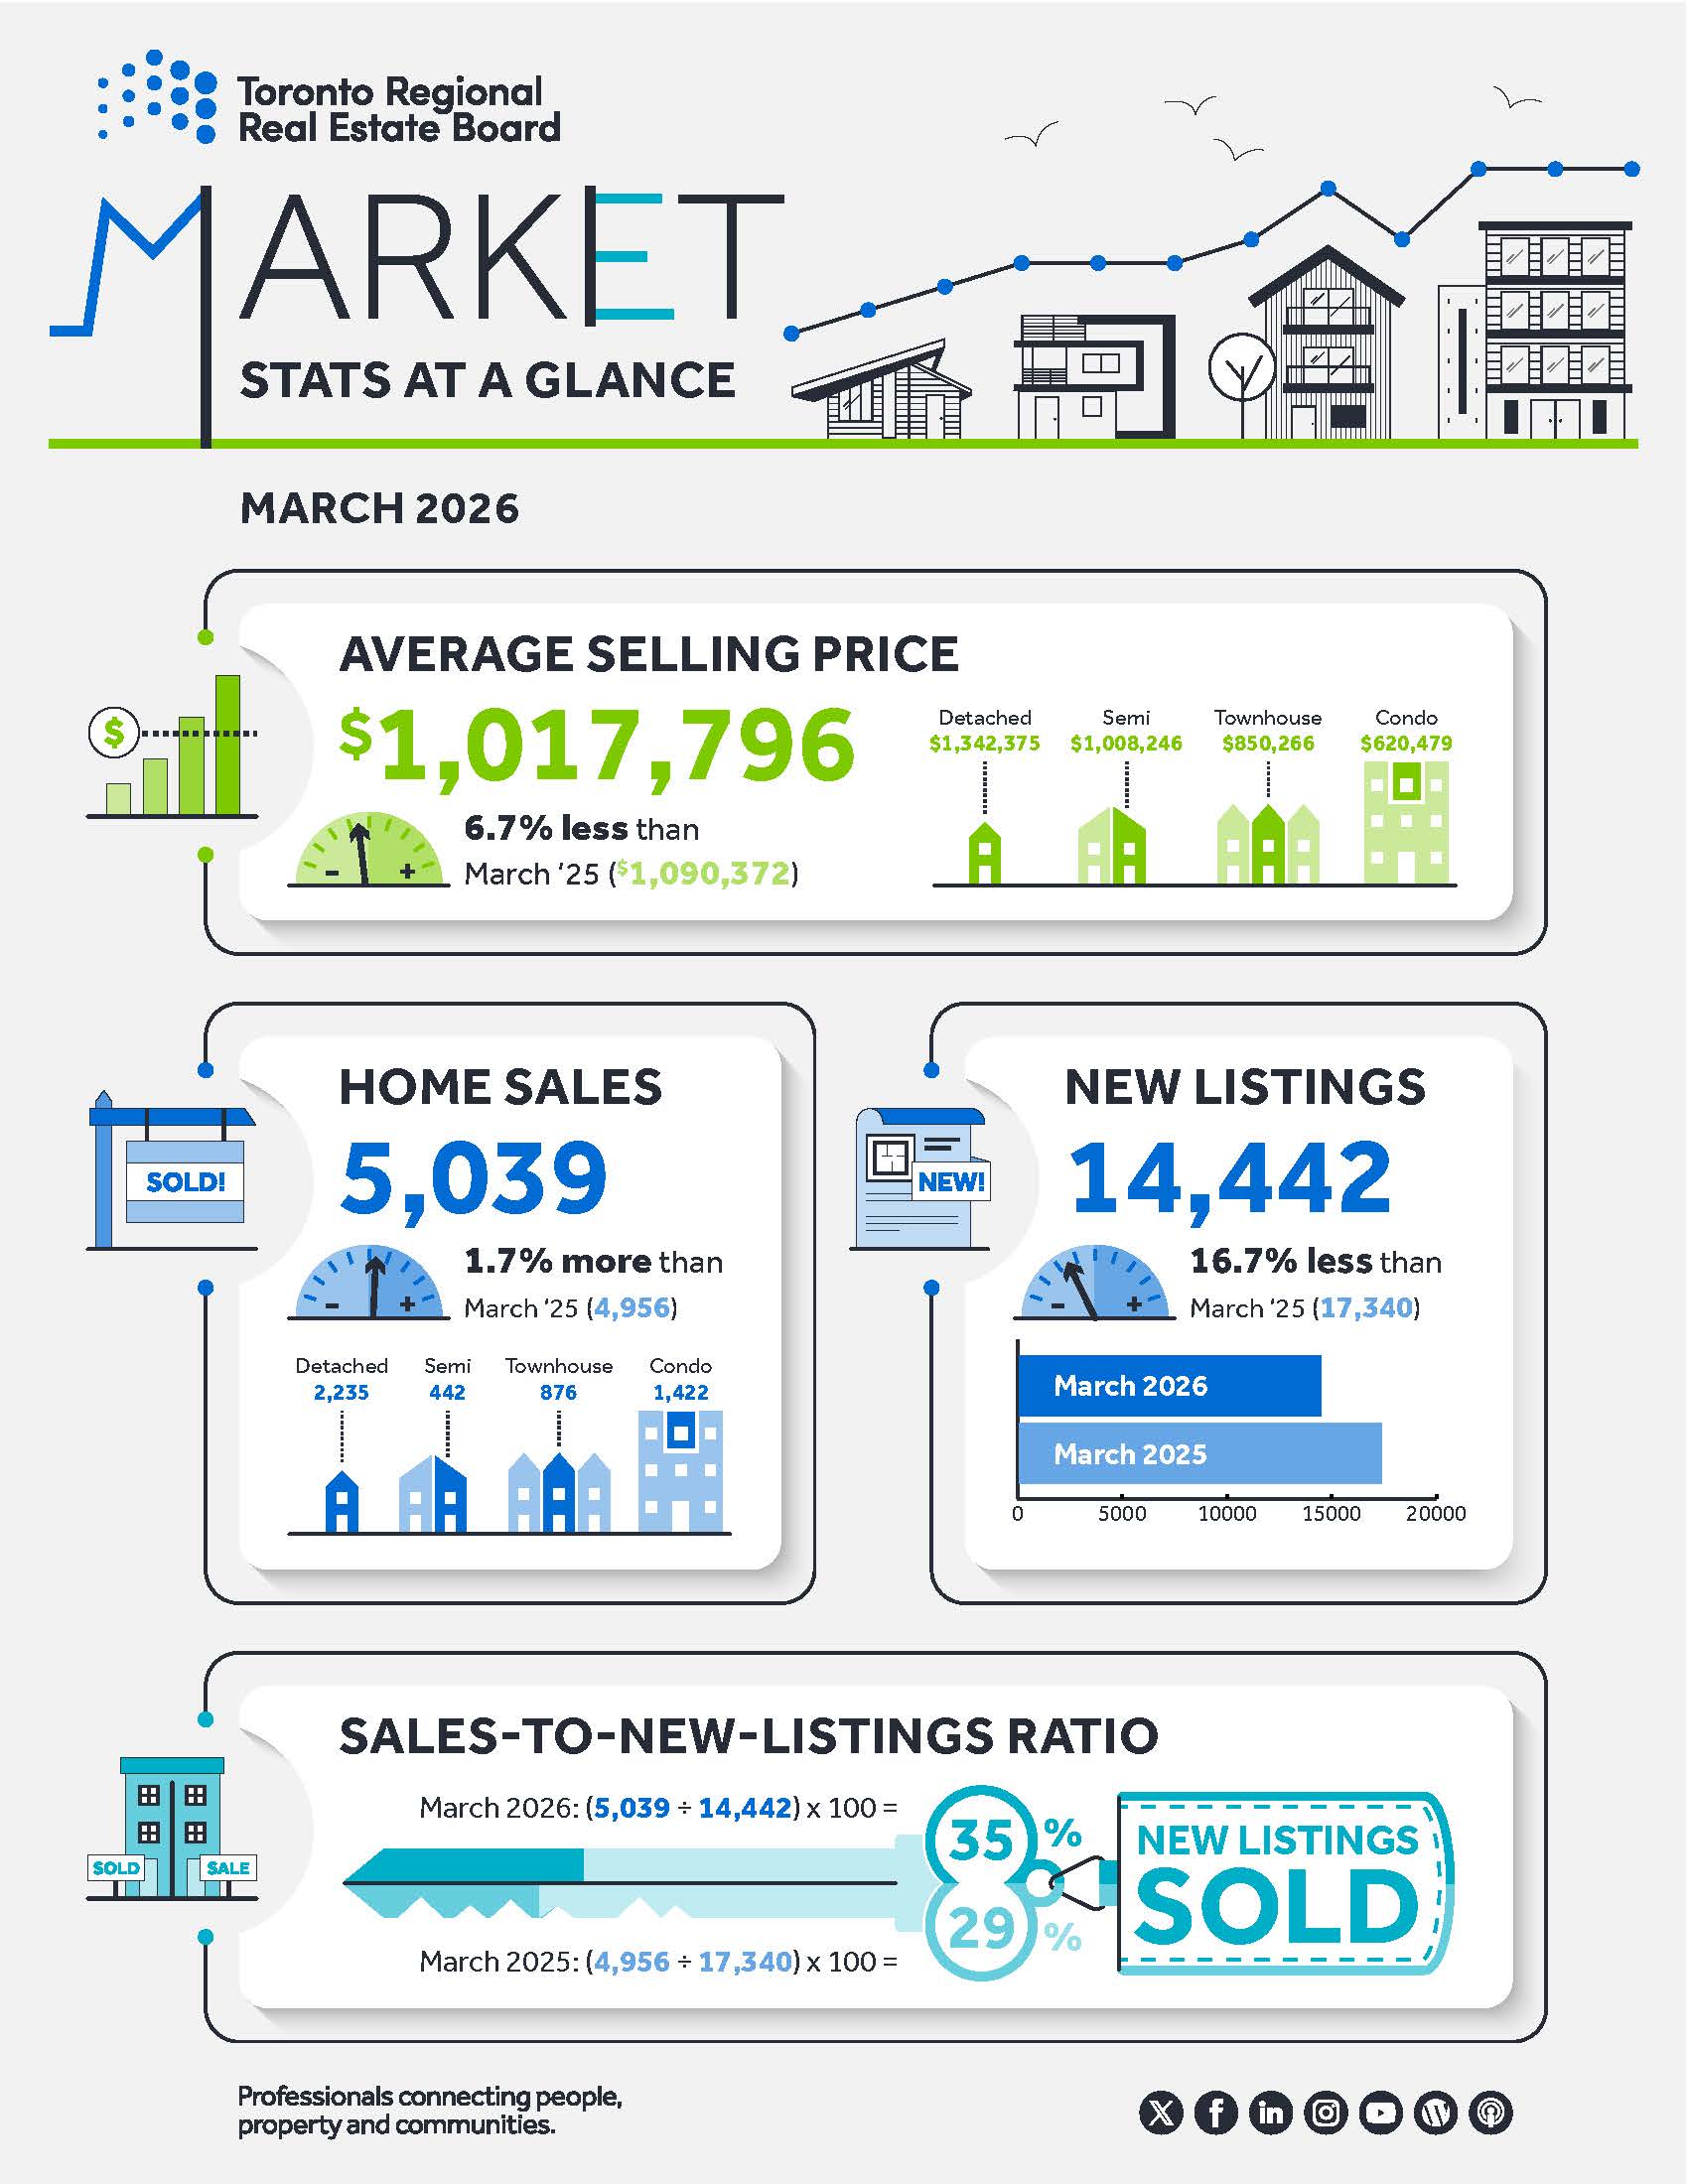
Average Sale Price: At $823,195, we are seeing a steady 0.8% increase over last month. However, we are down 5.2% from the $868,446 average seen in March 2025.
-
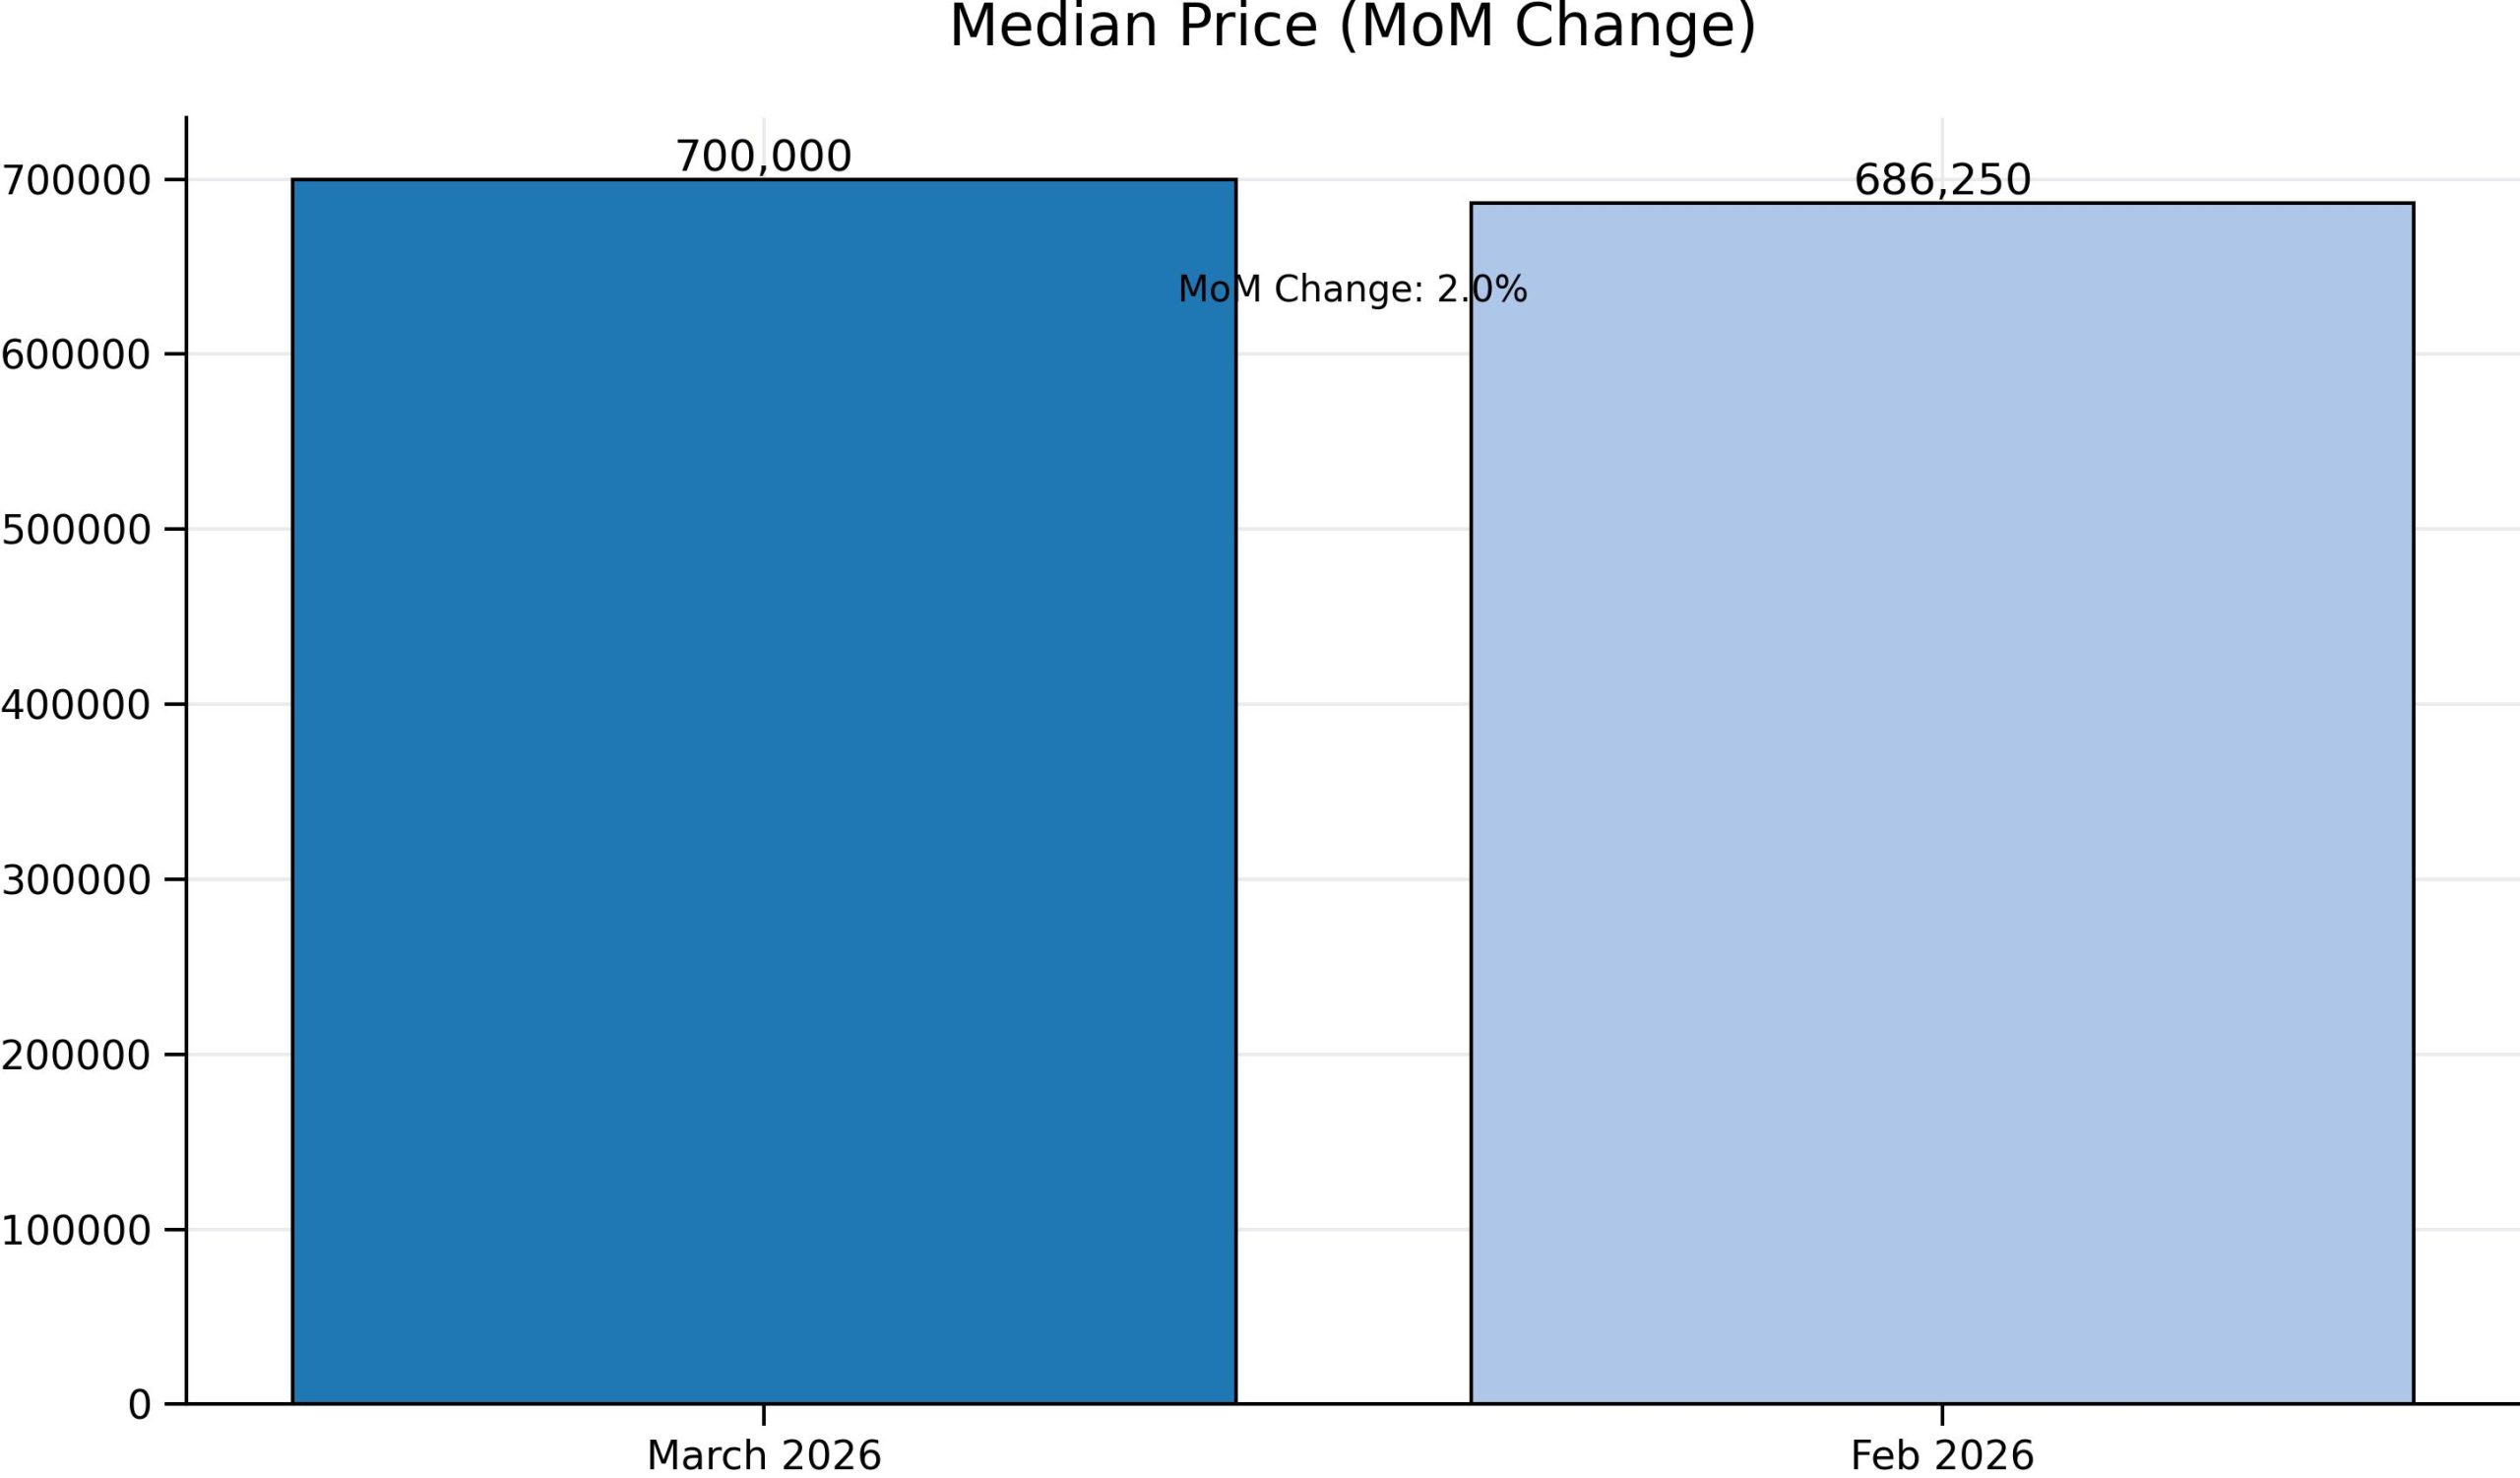
Median Sale Price: This is often a more accurate “middle-of-the-road” indicator. The median price rose 2.0% month-over-month to $700,000.
-
The List Price Anomaly: You may notice the Average List Price skyrocketed to over $21 million. This is a statistical anomaly caused by ultra-luxury inventory hitting the market, which skews the “average” but not the “median.”
The Takeaway for Sellers: Pricing is a delicate art right now. Over-shooting the market leads to terminations, while pricing at the “sweet spot” ensures you remain part of the successful transaction volume.
See what your home is worth today at www.GeraldLawrence.Realtor.
2. Inventory and Absorption: The Spring Surge
The most striking data point this month is the massive influx of activity. Both buyers and sellers emerged from winter hibernation with a vengeance.
The Volume Velocity
| Metric | March 2026 | MoM Change | What it Means |
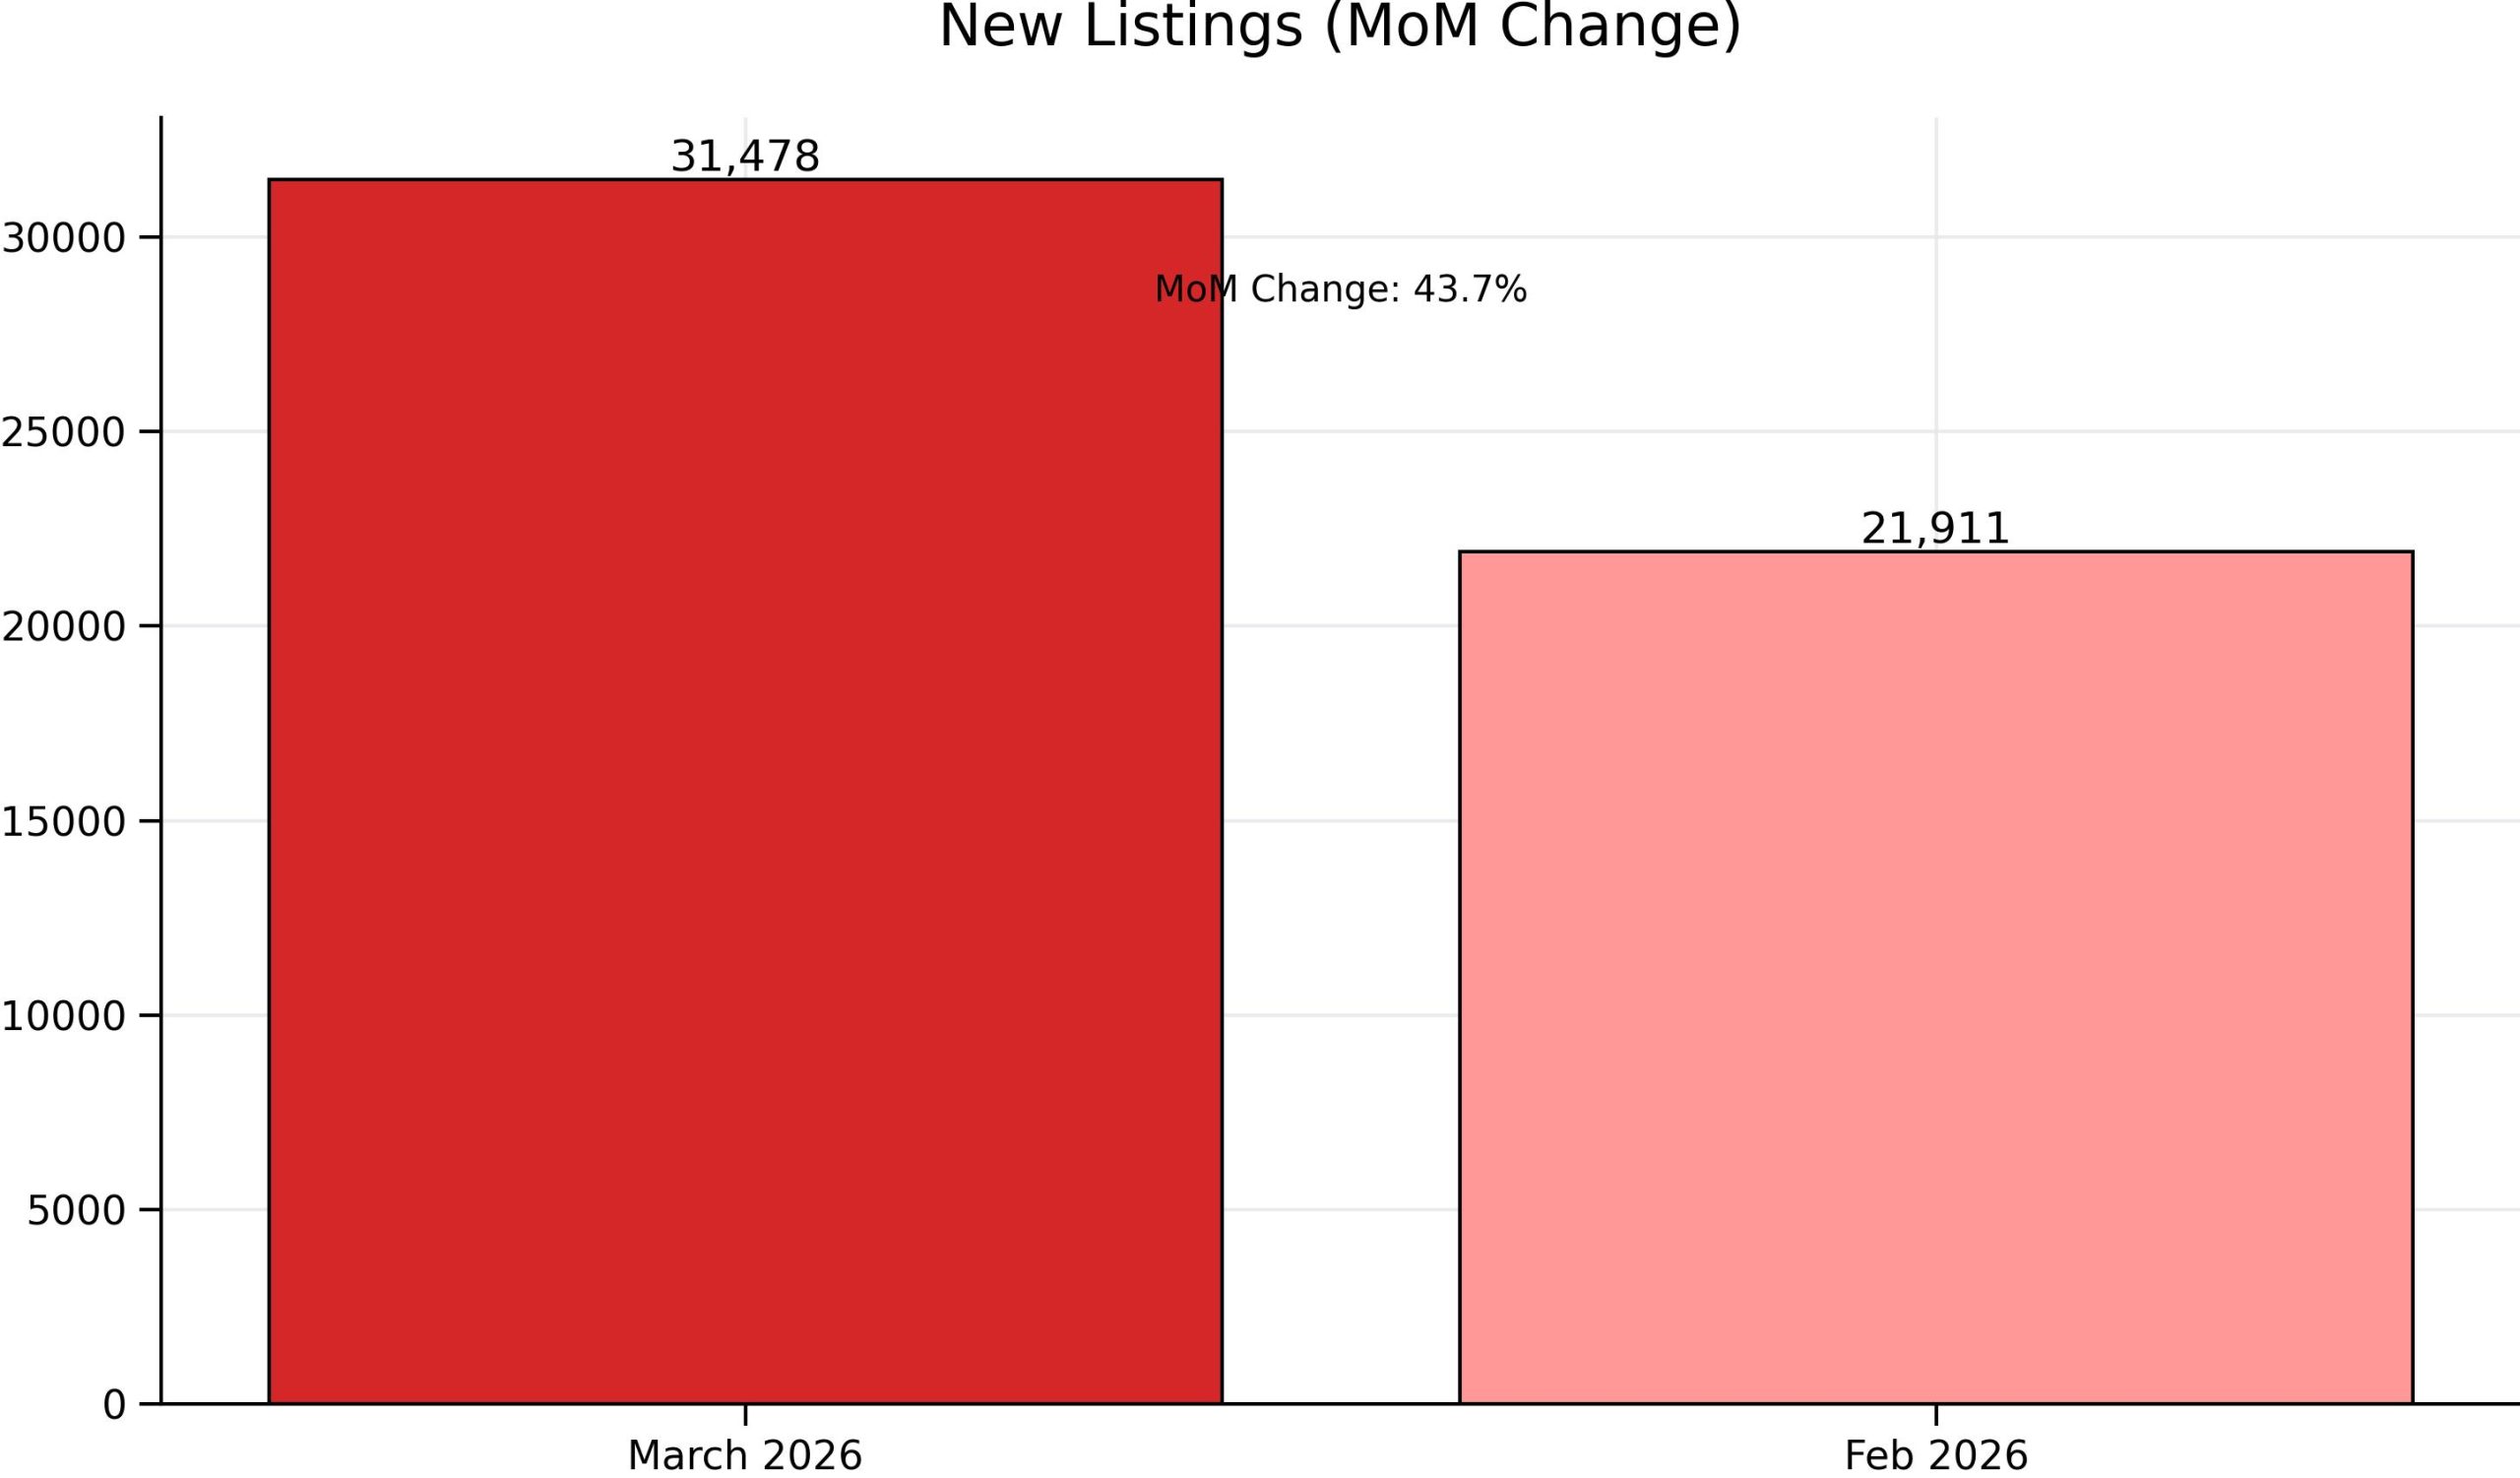
| New Listings | 31,478 | +43.7% | A huge selection of homes for buyers. |
| Transaction Volume | 10,934 | +30.8% | Buyers are active and absorbing inventory. |
| Terminations | 9,681 | +43.1% | Sellers are quickly pivoting if their initial strategy fails. |
The high termination volume suggests that the market is unforgiving of overpricing. Sellers who don’t see immediate traction are choosing to pull their listings and rethink their strategy rather than sitting stagnant on the market.
3. The “List-to-Sale” Reality Check
One of the most vital metrics for managing expectations is the Sales Price to List Price (SP/LP) ratio. In March 2026, the median SP/LP sat at 97.5%.
Where do the Sales Fall?
-
Below List Price (77.0%): The vast majority of transactions involved a negotiation. Buyers are successfully finding value below the asking price.
-
Above List Price (18.1%): Multiple offer scenarios still exist, but they are becoming the exception rather than the rule, down significantly from 24.3% last year.
-
At List Price (4.8%): A small fraction of homes sell exactly for the “sticker price.”
![]()
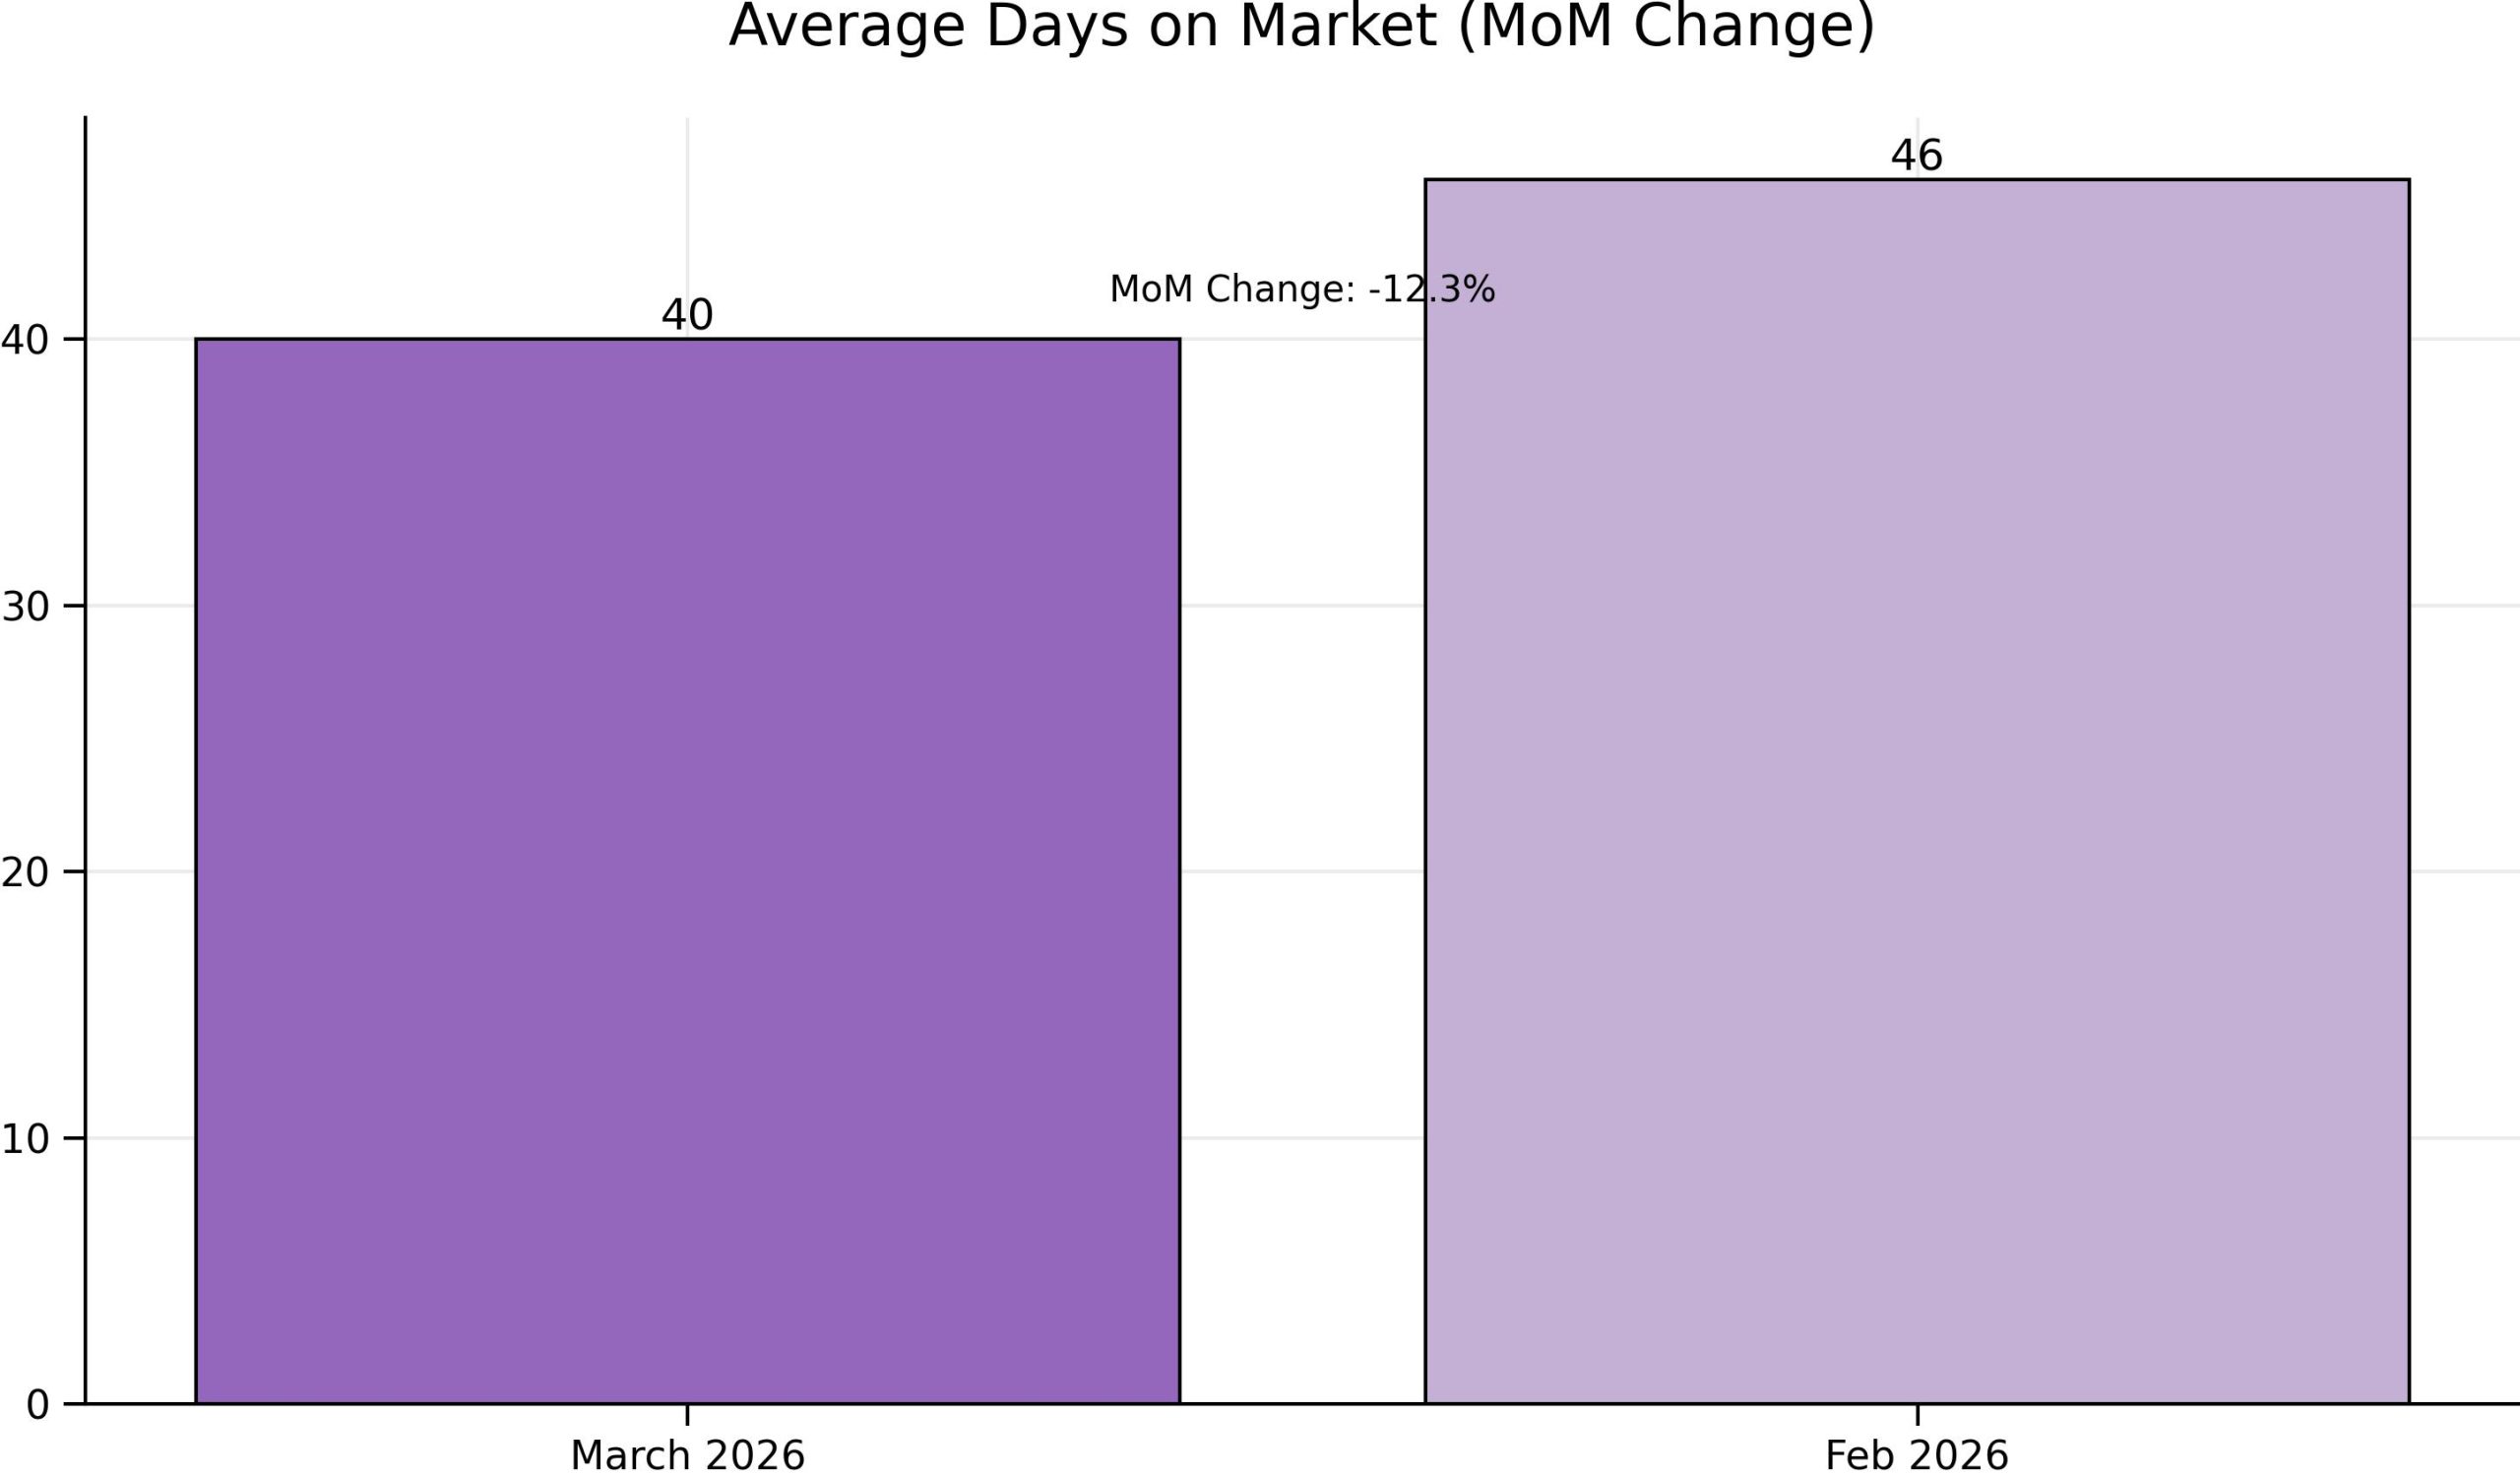
4. Time is of the Essence: Days on Market (DOM)
How long will it take to sell? The “Days on Market” metric is shrinking as we move deeper into the spring, but it remains higher than the frenetic pace of 2025.
-
Average DOM: 40 Days (A 12.3% decrease from last month).
-
Median DOM: 23 Days.
The “23-Day Rule”: In this market, the first three weeks are your “Golden Window.” If your property hasn’t seen a serious offer within 23 days, the data suggests it may be time to look at your pricing or presentation.
Don’t leave your timeline to chance. I specialize in aggressive marketing strategies that cut through the noise. Start your journey at www.GeraldLawrence.Realtor.
5. Strategic Guide for Buyers and Sellers
For the 2026 Home Seller
The market is active, but buyers are disciplined. To win, you must:
-
Stage for Success: With 31,000+ new listings to compete with, your home must be “magazine ready.”
-
Monitor the “Total Dollar Volume”: Total volume is down 12.6% YTD, meaning there is less total capital moving through the system. You need an agent who knows how to capture the serious buyers who are ready to act.
-
Use the Data: Don’t guess. Use the 97.5% median sale-to-list ratio to price your home strategically from day one.

For the 2026 Home Buyer
This is the most “buyer-friendly” spring we have seen in years.
-
Leverage the Terms: Since 77% of homes sell below list, you have the power to negotiate not just price, but conditions (inspections, financing, etc.).
-
Move on the Median: Since the median DOM is 23 days, you have time to do your due diligence, but you shouldn’t dawdle on high-quality listings.
-
Watch the YTD Trends: Prices are down 5.6% YTD compared to last year. Your purchasing power is effectively higher than it was twelve months ago.
6. Closing Summary: The Big Picture
The March 2026 report paints a picture of a vibrant, high-volume market that has finally moved away from the “panic buying” of years past. We are entering an era of Rational Real Estate, where data-driven decisions and professional representation are the difference between a “Sold” sign and a “Terminated” listing.
Ready to make your move in Ontario?
The market waits for no one, and neither should you. Whether you’re looking to capitalize on the 43.7% increase in new listings or you want to position your home for a top-dollar sale, I have the experience and the data to get you there.
Let’s connect today.
Web: www.GeraldLawrence.Realtor
Your Local Real Estate Expert
March 2026 KPI Infographic Summary
-
Average Price: $823,195 (Up 0.8% MoM)
-
Sales Volume: 10,934 (Up 30.8% MoM)
-
New Listings: 31,478 (Up 43.7% MoM)
-
Median Days on Market: 23 Days (Down 8% MoM)
-
Total Market Value: $9,000,818,546 (Up 31.9% MoM)