
 Facebook
 X
X
 Pinterest
 Copy Link
Housing Shift: Navigating April Pause – Buyers & Sellers Take Note!

Canadian Housing Market Pauses in April 2025 Amid Shifting Conditions
The Canadian housing market showed signs of a pause in its recent slump during April 2025, with national home sales remaining virtually unchanged from March. However, activity remains subdued compared to the previous year, and prices continue to see modest declines. This analysis, based on data released by the Canadian Real Estate Association (CREA), delves into the key trends observed in April.  Key Highlights for April 2025:
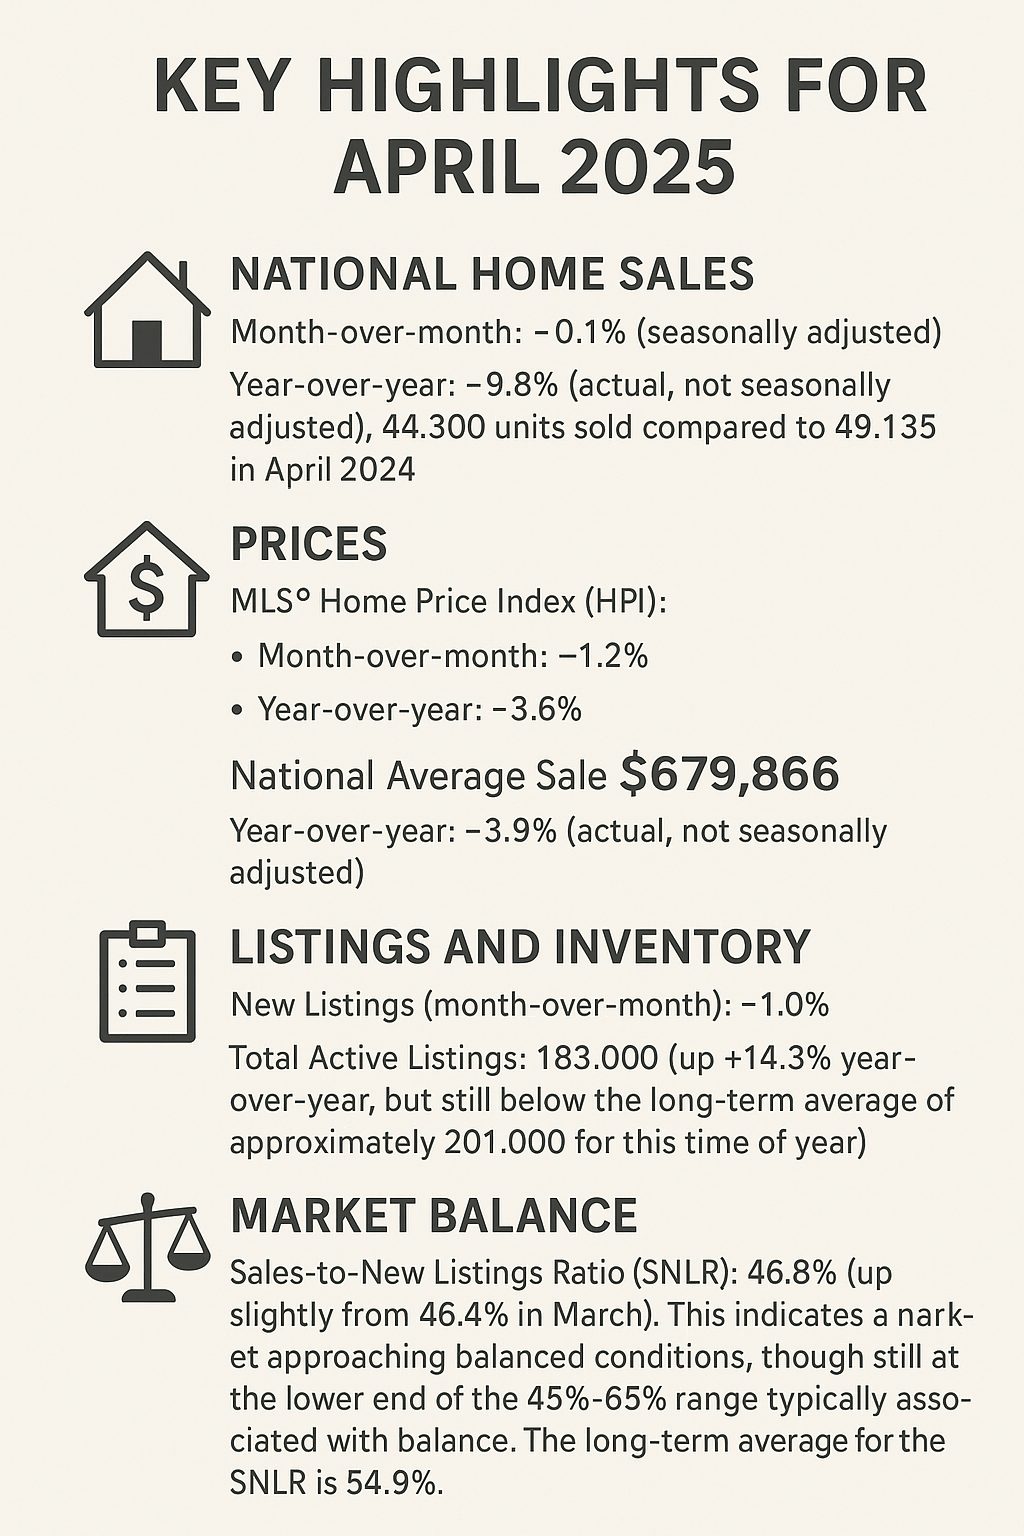
- National Home Sales:
- Month-over-month: -0.1% (seasonally adjusted)
- Year-over-year: -9.8% (actual, not seasonally adjusted), with 44,300 units sold compared to 49,135 in April 2024.
- Prices:
- MLS® Home Price Index (HPI):
- Month-over-month: -1.2%
- Year-over-year: -3.6%
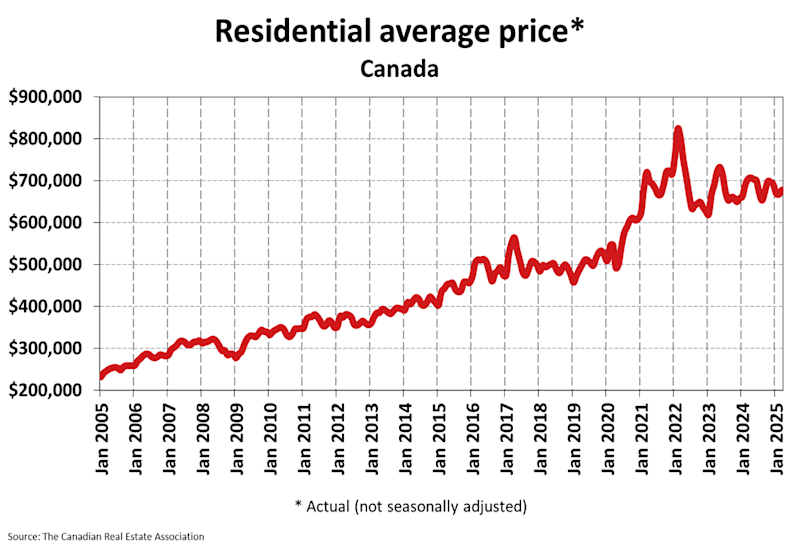
- National Average Sale Price: $679,866
- Year-over-year: -3.9% (actual, not seasonally adjusted)
- MLS® Home Price Index (HPI):
- Listings and Inventory:
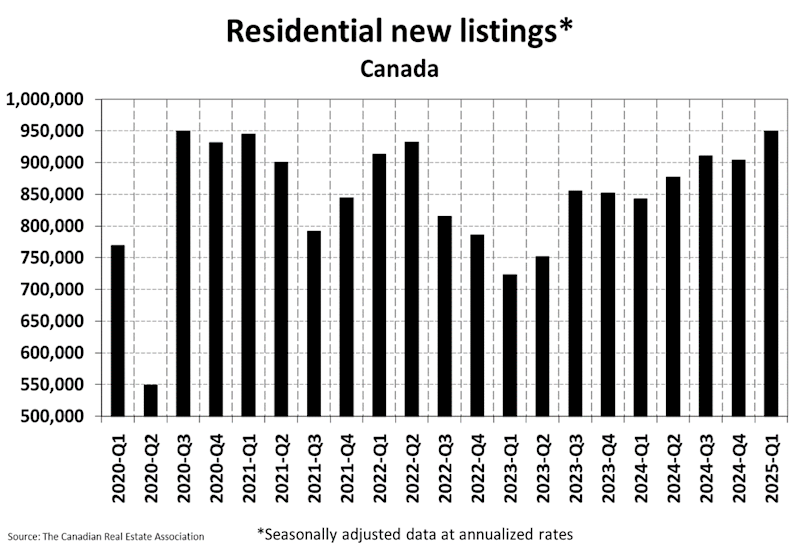
- New Listings (month-over-month): -1.0%
- Total Active Listings: 183,000 (up +14.3% year-over-year, but still below the long-term average of approximately 201,000 for this time of year).
- Market Balance:
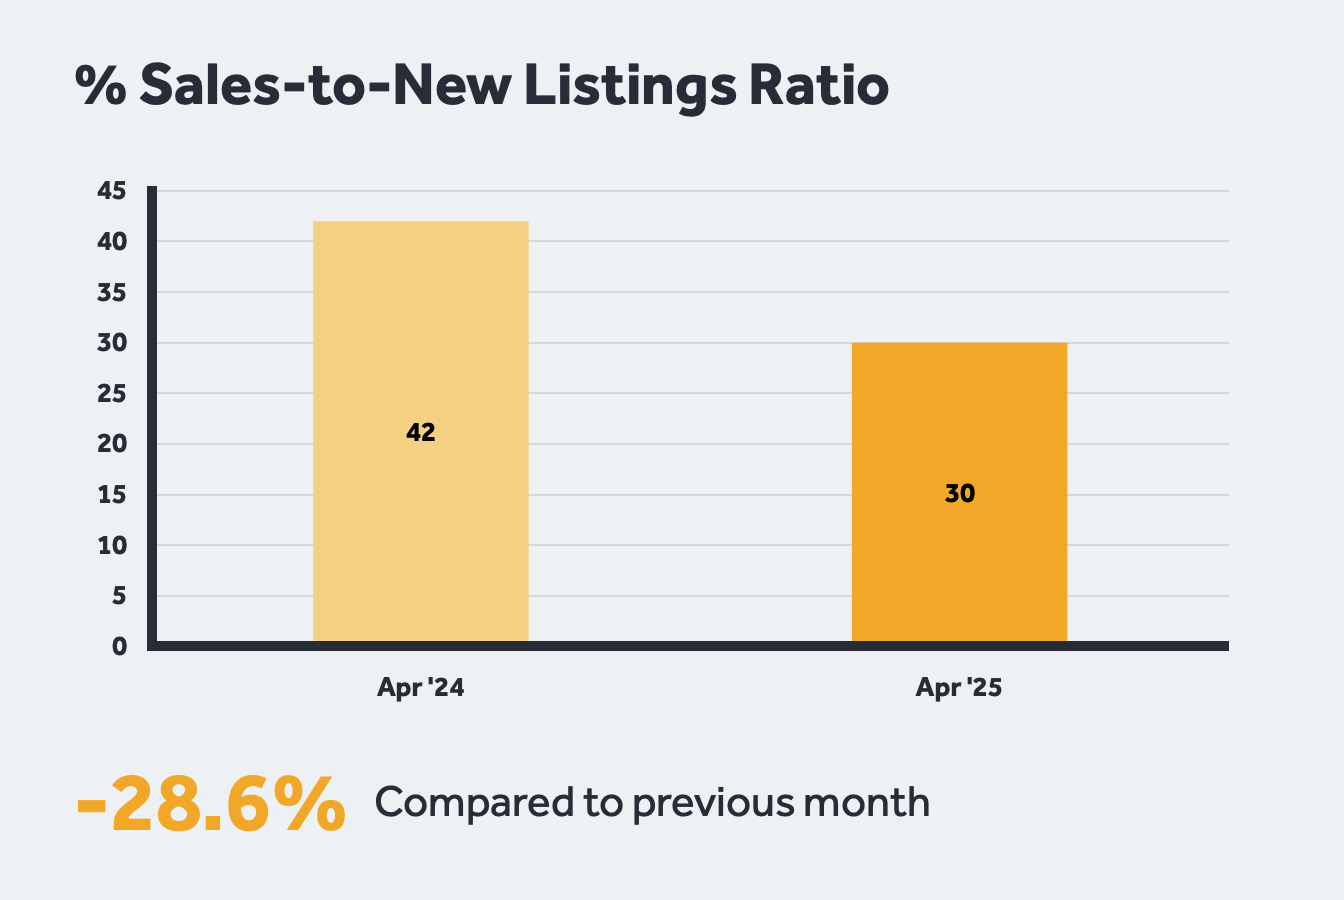
- Sales-to-New Listings Ratio (SNLR): 46.8% (up slightly from 46.4% in March). This indicates a market approaching balanced conditions, though still at the lower end of the 45%-65% range typically associated with balance. The long-term average for the SNLR is 54.9%.
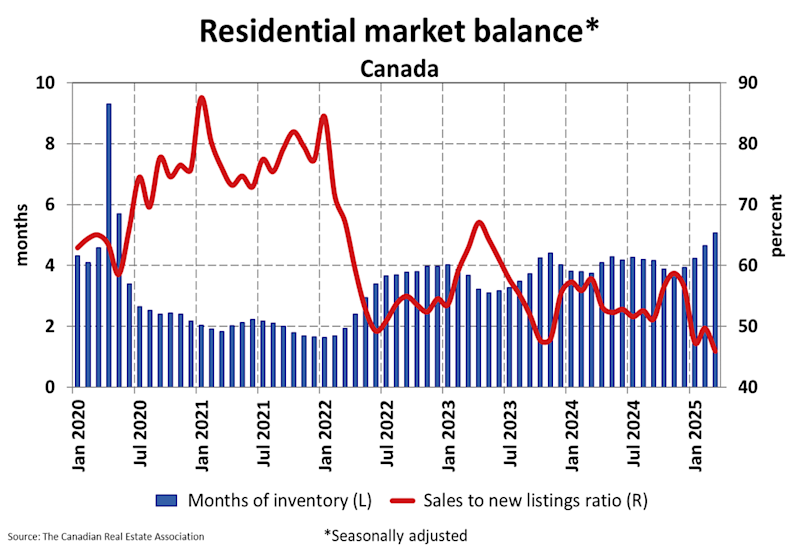
- Months of Inventory: 5.1 months, which is in line with the long-term average of five months. A seller’s market is typically below 3.6 months, and a buyer’s market above 6.4 months.
Detailed Analysis:
The April 2025 data suggests a stabilization in sales activity after several months of decline. Shaun Cathcart, CREA’s Senior Economist, noted that the market is returning to the “quiet markets we’ve experienced since 2022,” with factors like “tariff uncertainty taking the place of high interest rates in keeping buyers on the sidelines.”
While sales activity paused its descent on a month-over-month basis, the year-over-year comparison still shows a significant drop, indicating that the market is considerably cooler than in April 2024. Price pressures continue, with both the MLS® HPI and the national average sale price registering year-over-year declines.
The month-over-month decrease in the HPI suggests that price adjustments are ongoing. The number of newly listed properties dipped slightly in April compared to March. However, the total number of homes available for sale has increased notably from a year ago, offering more choice to potential buyers.
Despite this increase, total inventory remains below long-term averages. The sales-to-new listings ratio moving slightly up to 46.8% and 5.1 months of inventory suggest the national market is largely balanced, albeit with regional variations.  Regional Variations: The national figures mask significant regional differences. CREA reports indicate:
- Ontario and British Columbia: These more expensive markets are generally experiencing larger price pullbacks and higher inventory levels, with sales potentially decreasing more significantly.
- Maritimes, Quebec, Manitoba, and Saskatchewan (Prairies, East Coast): These traditionally more affordable regions are seeing some price resilience or even increases, along with tighter inventory conditions.
Valérie Paquin, CREA Chair, emphasized this divergence: “The number of homes for sale across Canada has almost returned to normal, but that is the result of higher inventories in B.C. and Ontario, and tight inventories everywhere else.” Visual Summary: The following charts illustrate some of the key trends: Total Active Listings vs. Long-Term Average (April 2025) This chart compares the total number of homes available for sale at the end of April 2025 against the typical long-term average for that time of year. It also notes the year-over-year change in active listings. 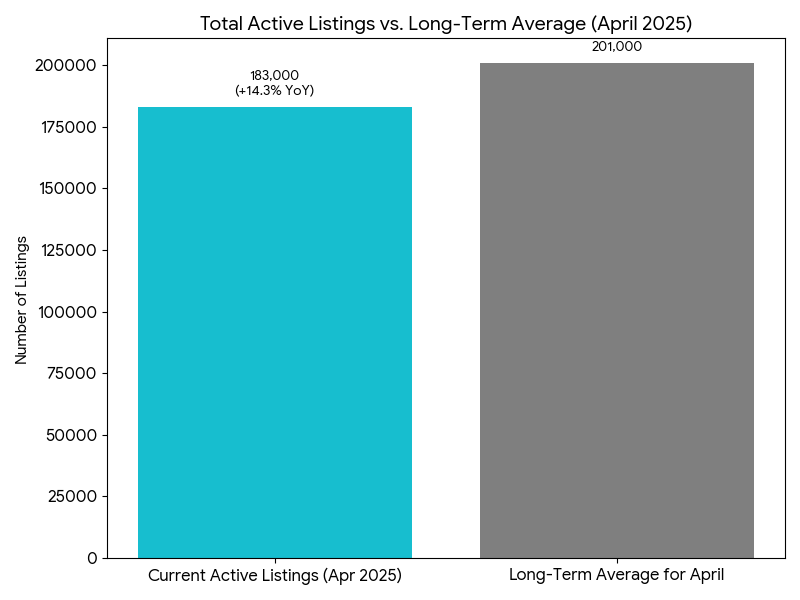 This chart compares the total number of homes available for sale at the end of April 2025 (183,000, up 14.3% year-over-year) against the typical long-term average for that time of year (approximately 201,000). It shows that while listings have increased from last year, they still haven’t reached the historical average for April. Sales-to-New Listings Ratio (SNLR) – April 2025 This chart shows the SNLR for April 2025, comparing it to the long-term average and the thresholds for different market conditions (buyer’s, balanced, seller’s).
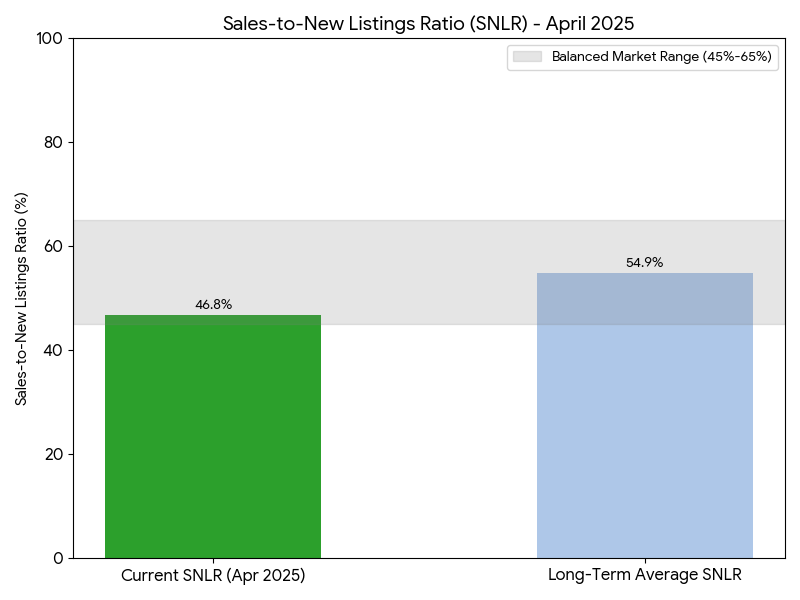
This chart shows the Sales-to-New Listings Ratio (SNLR) for April 2025 at 46.8%. It compares this to the long-term average SNLR of 54.9% and highlights the range typically considered a “balanced market” (45% to 65%). The current SNLR sits at the lower end of this balanced range, indicating that while the market isn’t strongly favouring buyers or sellers, it’s leaning slightly towards conditions that could offer buyers more leverage than if the ratio were higher.
Analysis:
April 2025 data points to a stabilization in sales activity following several months of declining figures. According to CREA’s Senior Economist, Shaun Cathcart, “the 2025 Canadian housing story would best be described as a return to the quiet markets we’ve experienced since 2022, with tariff uncertainty taking the place of high interest rates in keeping buyers on the sidelines.”
This suggests that while the sharp decline in sales may have paused, underlying caution persists among market participants. The year-over-year decrease in home sales by nearly 10% underscores that the market remains significantly cooler than in the spring of 2024. This slowdown in activity is accompanied by ongoing price adjustments.
Both the MLS® HPI and the national average sale price saw year-over-year decreases, with the HPI also declining month-over-month, indicating continued downward pressure on home values. On the supply side, new listings saw a slight dip from March to April. However, the total number of homes available for sale has risen substantially compared to the previous year, giving prospective buyers more options.
Despite this increase, overall inventory levels have not yet reached their long-term averages for this time of year. The national market, as indicated by the SNLR and months of inventory, appears to be in a state of balance. However, this national picture is an aggregation of varied local conditions. Regional Variations: The Canadian housing market is not monolithic, and significant regional differences persist:
- Ontario and British Columbia: These provinces, particularly their more expensive urban centers, are generally experiencing more pronounced price pullbacks. Inventory levels are higher, and sales activity has seen more significant declines compared to other parts of the country.
- Prairie Provinces (Alberta, Saskatchewan, Manitoba) and Atlantic Canada (Maritimes, Newfoundland and Labrador), and Quebec: In contrast, many markets in these regions are demonstrating more resilience. Some are even witnessing modest price growth and continue to experience tighter inventory conditions relative to demand.
CREA Chair Valérie Paquin highlighted this disparity, stating, “The number of homes for sale across Canada has almost returned to normal, but that is the result of higher inventories in B.C. and Ontario, and tight inventories everywhere else.” This underscores the importance of understanding local market dynamics when considering buying or selling property. Visual Summary of Key Market Indicators: The following charts provide a visual representation of some of the key changes in the Canadian housing market for April 2025: Canadian Housing Market – Year-over-Year Changes (April 2025 vs April 2024) 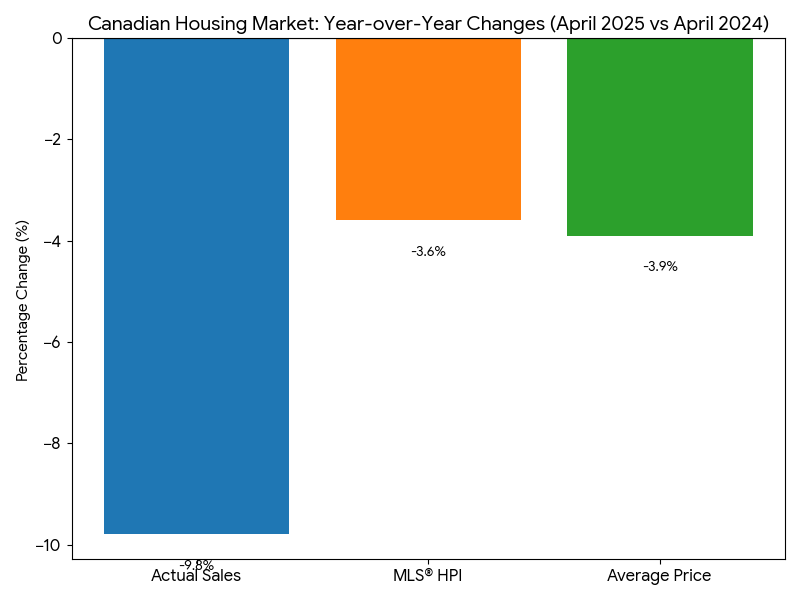 This chart illustrates the percentage change in actual home sales, the MLS® Home Price Index, and the national average sale price compared to April of the previous year. All key metrics show a decline, highlighting the cooling trend. Canadian Housing Market – Month-over-Month Changes (April 2025 vs March 2025)
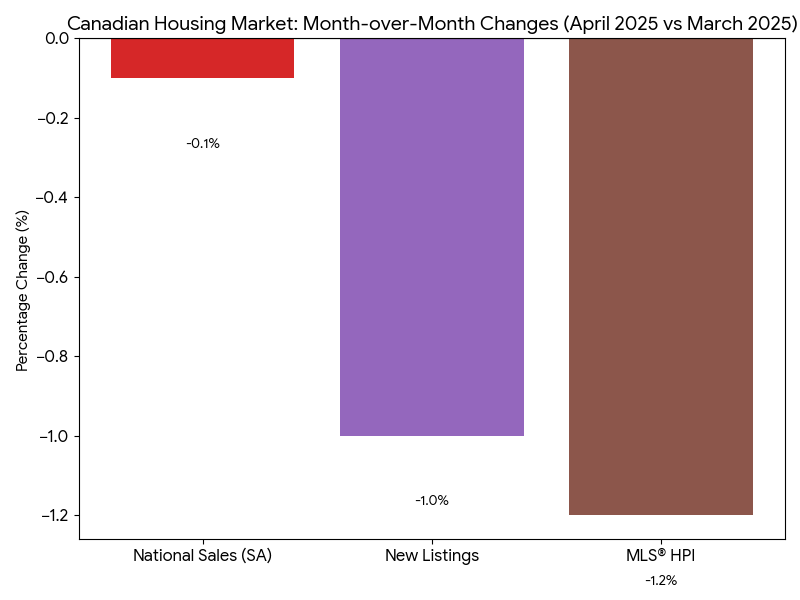
This chart displays the percentage change in seasonally adjusted national home sales, new listings, and the MLS® Home Price Index compared to the preceding month. It shows a near flatline in sales, a slight decrease in new listings, and a continued modest decline in the HPI. In conclusion, the Canadian housing market in April 2025 was characterized by a pause in the recent sales slump, ongoing price moderation, and a nationally balanced market that masks significant regional variations. Factors such as economic uncertainty, including trade tariff concerns, continue to influence buyer and seller behavior.
Recommendation for a Seller Considering Listing Their Home:
The decision to sell your home is significant, and the current market presents a nuanced landscape. While national prices have seen some moderation and sales activity, though stabilizing month-over-month, remains below last year’s levels, there are compelling reasons to consider listing, especially if your circumstances align. Why This Might Be a Good Time for You to Sell:
- Stabilizing Market Activity: After a period of decline, national sales activity showed signs of pausing its slump in April. This could indicate that buyers who were on the sidelines are beginning to re-engage, potentially creating a window of opportunity before any further significant market shifts.
- Inventory Levels Offer a Mixed Picture: While total active listings are up year-over-year (meaning more competition than last year), they still remain below the long-term average for this time of year in many areas. A well-priced and well-presented home can still capture significant attention.
- Regional Strengths Persist: If your property is located in markets like the Prairies, Quebec, or parts of Atlantic Canada, you might find conditions are still relatively strong with resilient pricing and tighter inventories. Even in markets like Ontario and BC that have seen more significant price adjustments, unique properties in desirable locations can still attract motivated buyers.
- Capture Current Price Levels: While prices have dipped from their peak, they are still substantial in many regions compared to historical levels. If you’re concerned about further price erosion, selling now could allow you to lock in your property’s current value. Waiting doesn’t guarantee a better outcome, especially if national price trends continue their modest decline.
- Motivated Buyers Are Still Active: Serious buyers are always in the market. Those active now are likely navigating current conditions with clear intentions, potentially leading to smoother transactions if you connect with the right one.

To maximize your success, it’s crucial to:
- Price Strategically: Overpricing in this market can lead to your home sitting longer. Work closely with a local real estate professional to set a competitive and realistic price based on the very latest comparable sales.
- Ensure Your Home Shines: With more choice for buyers than last year, presentation matters more than ever. Invest in staging, decluttering, and addressing any necessary repairs.
- Be Flexible: Understand that negotiation might be more common. Being open to reasonable offers and conditions can facilitate a successful sale.
If your personal and financial goals align with a move, listing now allows you to capitalize on the current buyer interest and potentially transition to your next property with more clarity than in a more volatile market.

Recommendation for a Buyer Considering Entering the Market:
For prospective homebuyers, the April 2025 market data reveals an environment that offers several advantages compared to the frenetic conditions of the recent past. If you’re financially prepared, this could be an opportune time to make your move. Why This Might Be a Good Time for You to Buy:
- Increased Choice and Less Frenzy: The 14.3% year-over-year increase in total active listings means you have more properties to choose from. With national sales down 9.8% compared to last April, there’s generally less competition for each home, reducing the likelihood of intense bidding wars.
- Price Moderation Offers Better Value: Both the MLS® Home Price Index and the national average sale price have declined year-over-year (by -3.6% and -3.9% respectively). This softening of prices can make homeownership more accessible and potentially offer better long-term value.
- More Balanced Market Conditions: Key indicators like the Sales-to-New Listings Ratio (46.8%) and Months of Inventory (5.1 months) point towards a more balanced national market. This environment typically affords buyers more time for due diligence, less pressure to make rushed decisions, and potentially more room for negotiation on price and conditions.
- Favourable Conditions in Certain Regions: If you are looking in markets like Ontario or British Columbia, you may find more significant price pullbacks and a greater willingness from sellers to negotiate, creating specific buying opportunities.
- Opportunity for Long-Term Investment: Housing is a long-term investment. Entering the market during a period of price stabilization or modest decline can be advantageous for buyers with a long-term horizon, as you’re potentially buying at a more sustainable price point.
- Stable Interest Rate Environment (Relatively Speaking): While interest rates remain a key consideration, the acute uncertainty around rapid rate hikes has somewhat subsided. This allows for more predictable mortgage planning. Shaun Cathcart of CREA noted “tariff uncertainty taking the place of high interest rates in keeping buyers on the sidelines,” suggesting some buyers might be adapting to the current rate environment.

To make the most of the current market, consider the following:
- Get Pre-Approved for a Mortgage: Know your budget definitively. This will strengthen your negotiating position.
- Work with an Experienced Buyer’s Agent: They can help you identify suitable properties, understand local micro-market conditions, and guide you through the negotiation process.
- Don’t Try to Perfectly Time the Bottom: It’s nearly impossible to buy at the absolute lowest point. Focus on finding a home that meets your needs and budget in a market that is offering more favorable conditions than seen in quite some time.
If you have a stable financial situation and a long-term perspective, the current market conditions provide a window of opportunity to purchase a home with more choice, less pressure, and potentially better value. 
 |
 |
 |
 |
 |
 |

📊 GTA Real Estate Market Trends – April 2025 Update

Author: Gerald Lawrence, REALTOR®
Published: May 9, 2025
Reading Time: 7-9 minutes
🔍 Introduction
The Greater Toronto Area (GTA) real estate market continued to evolve in April 2025, reflecting broader economic pressures, buyer psychology, and seasonal trends. Whether you’re a homeowner, investor, or first-time buyer, understanding current housing data is critical.
In this article, we break down the latest TRREB Market Watch statistics, offer insight into price fluctuations, sales activity, and what this all means for your next move in the real estate market.
📈 Key Highlights for April 2025
| Metric | April
2025 |
April
2024 |
% Change
YoY |
|---|---|---|---|
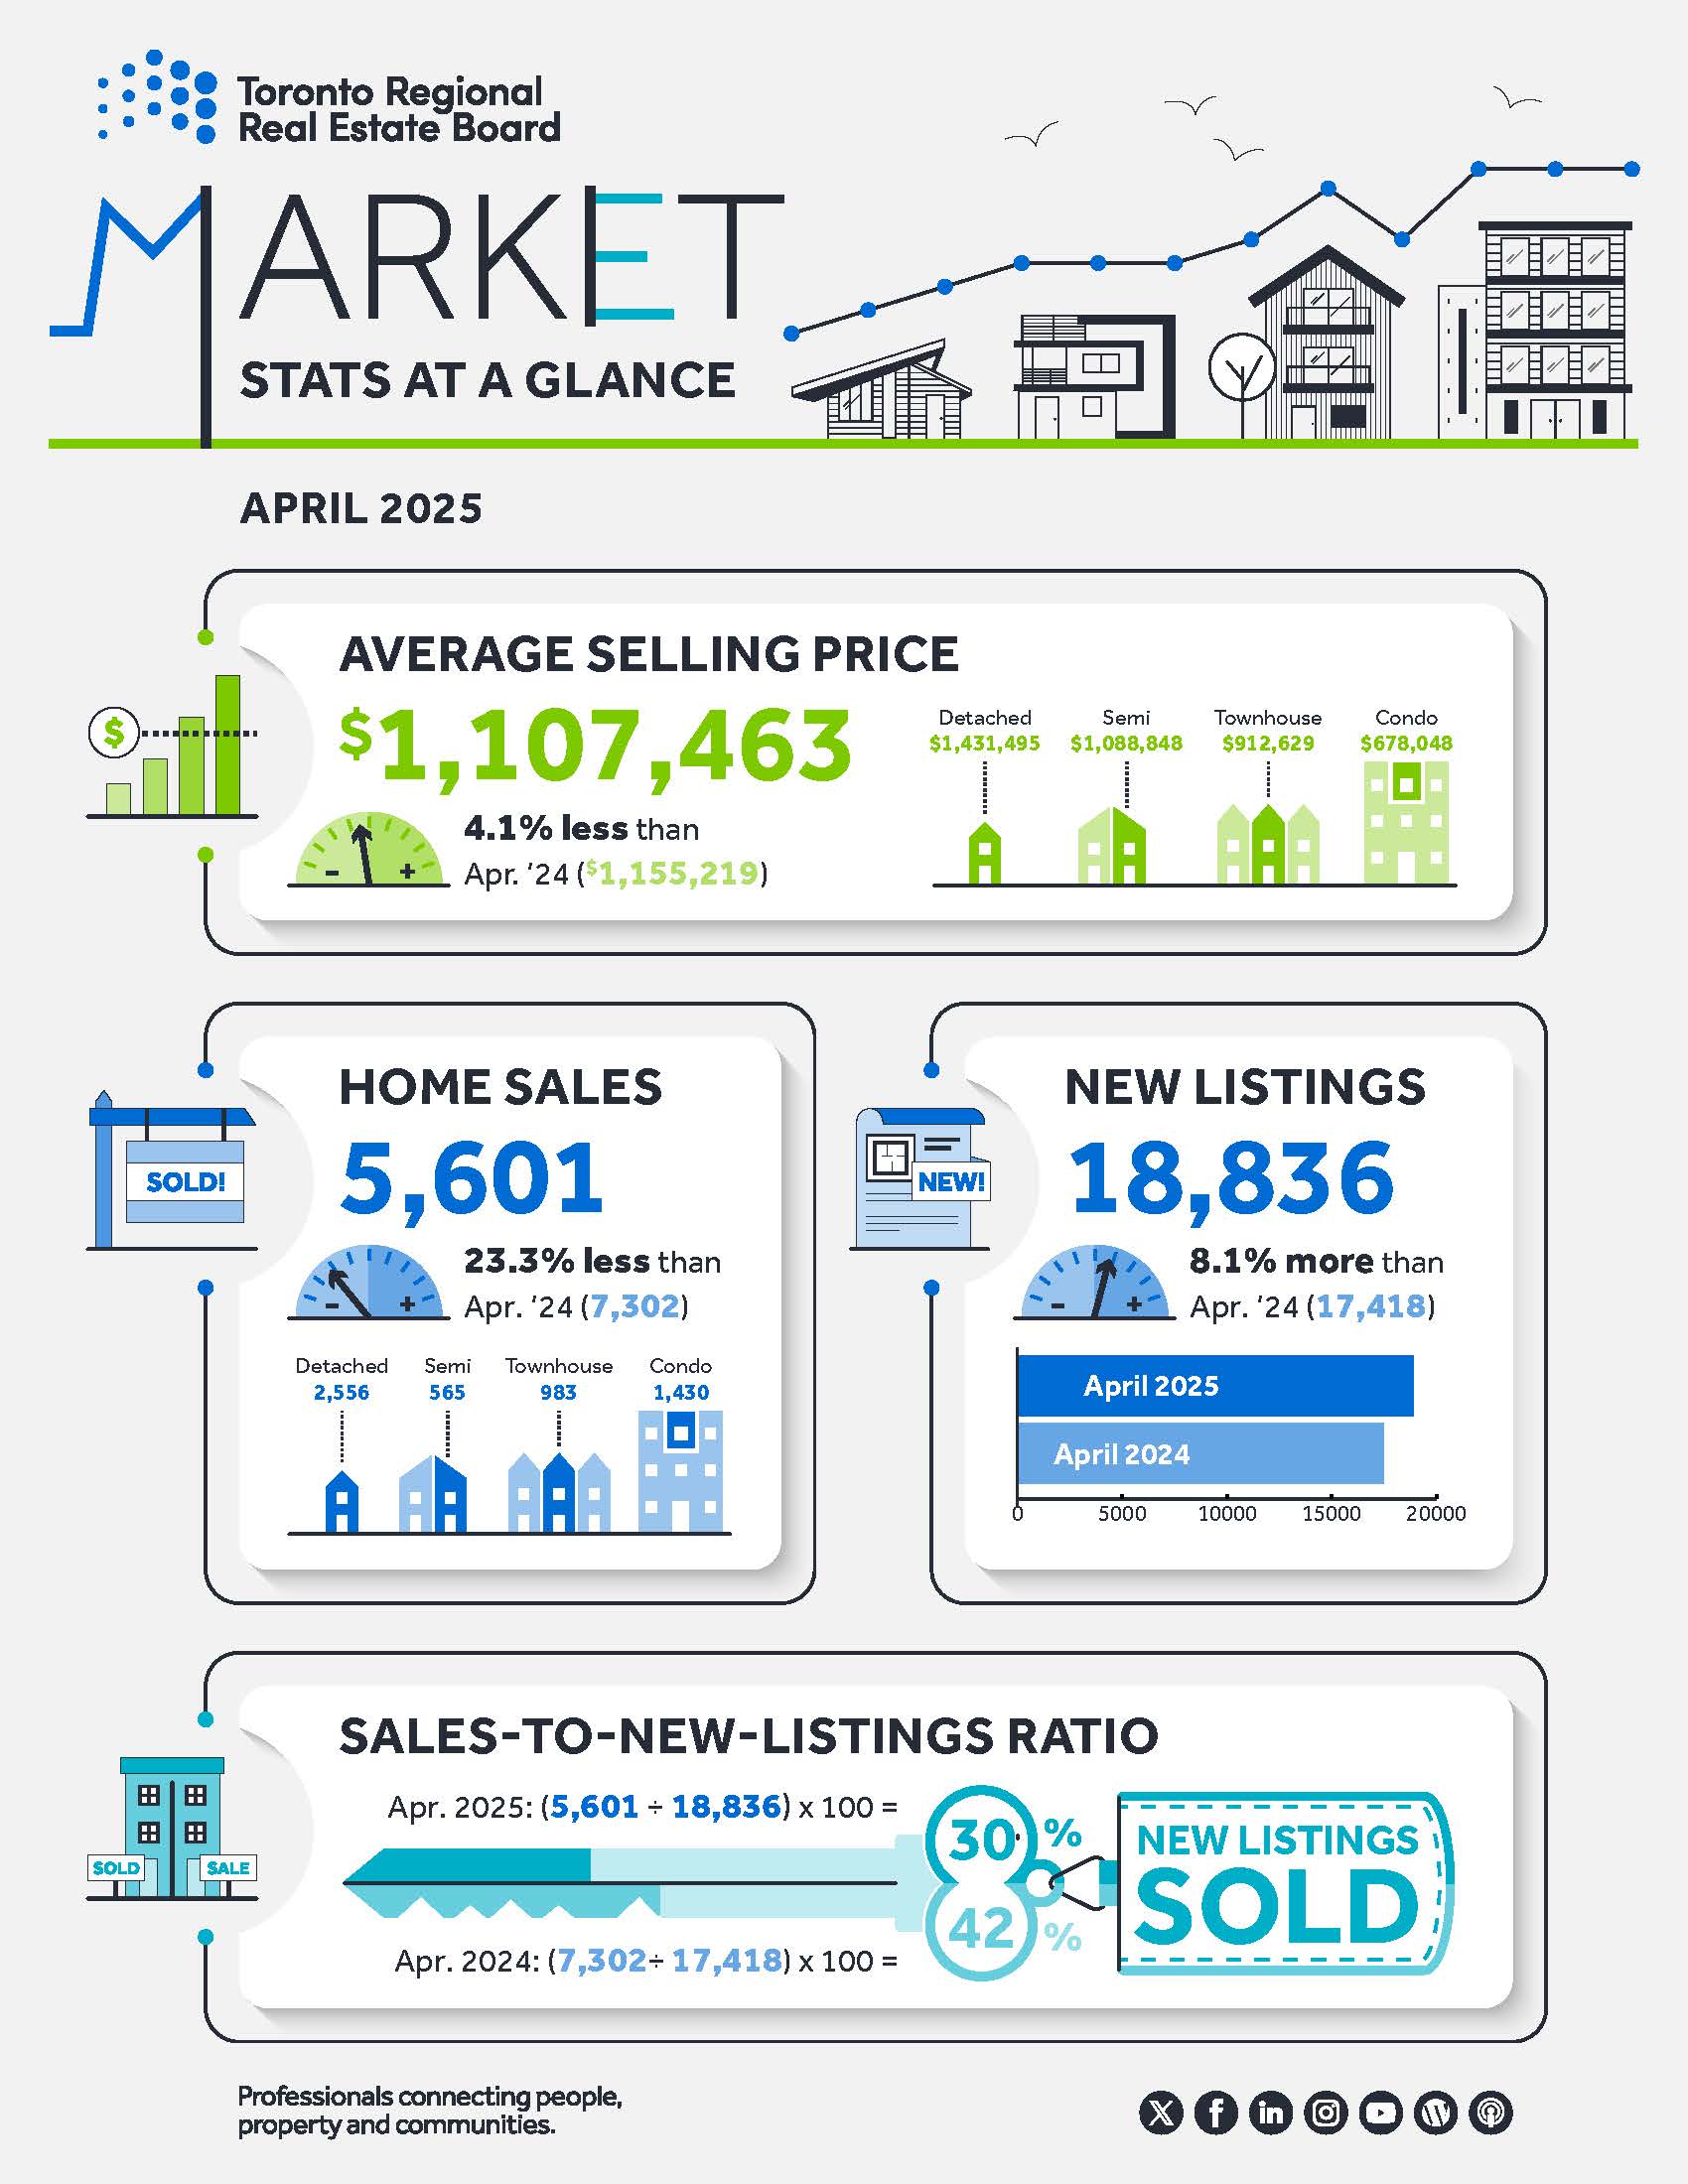
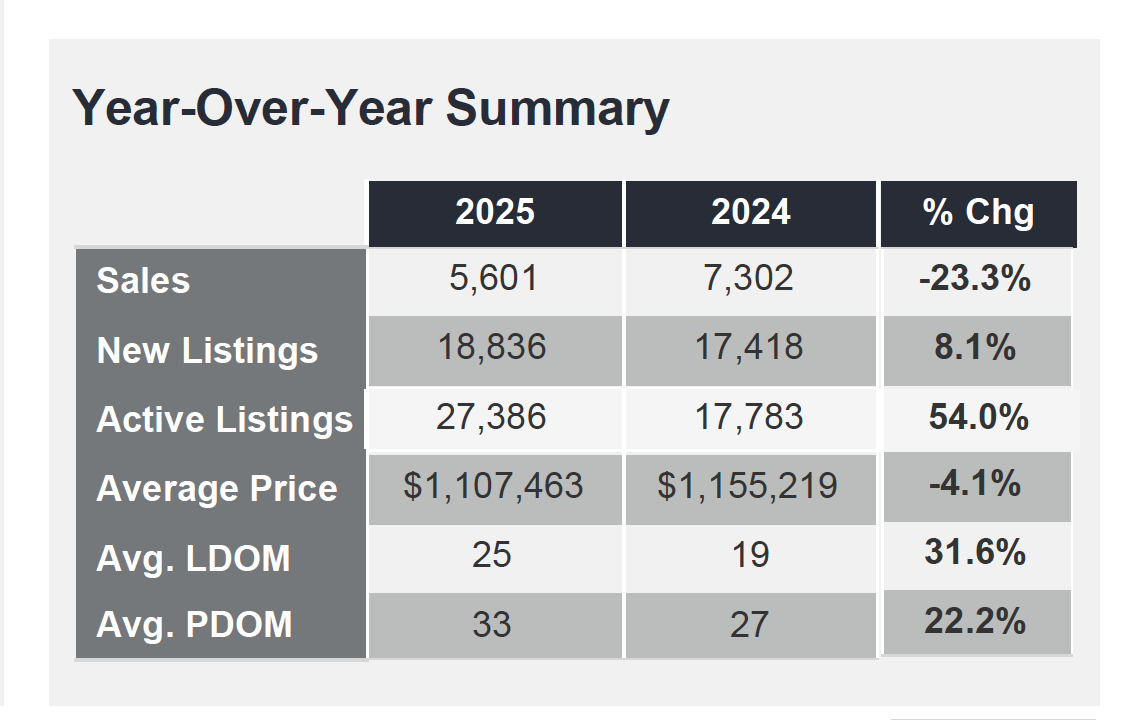
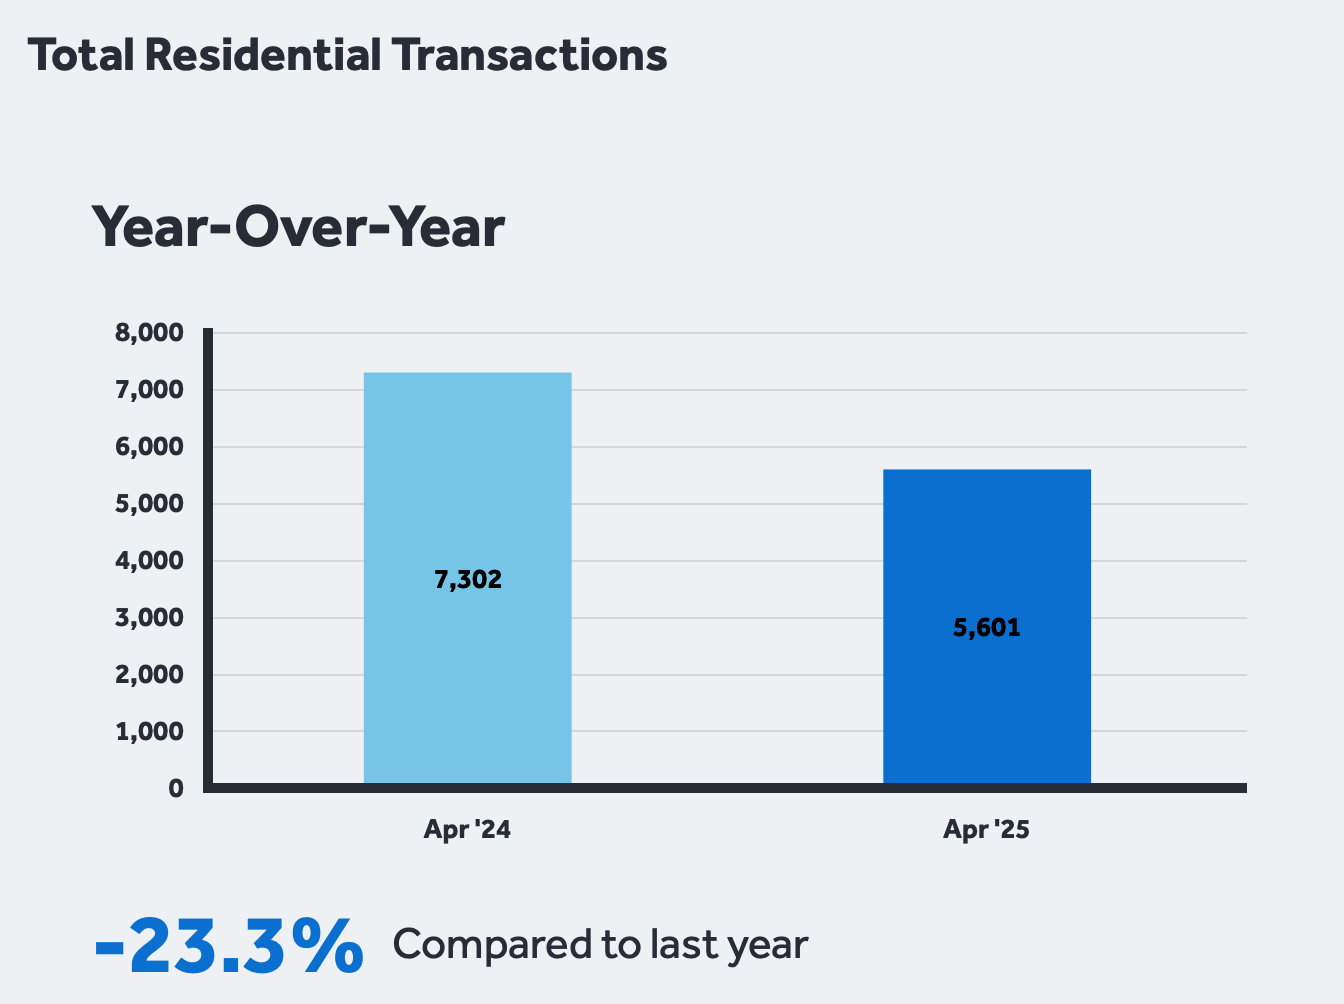
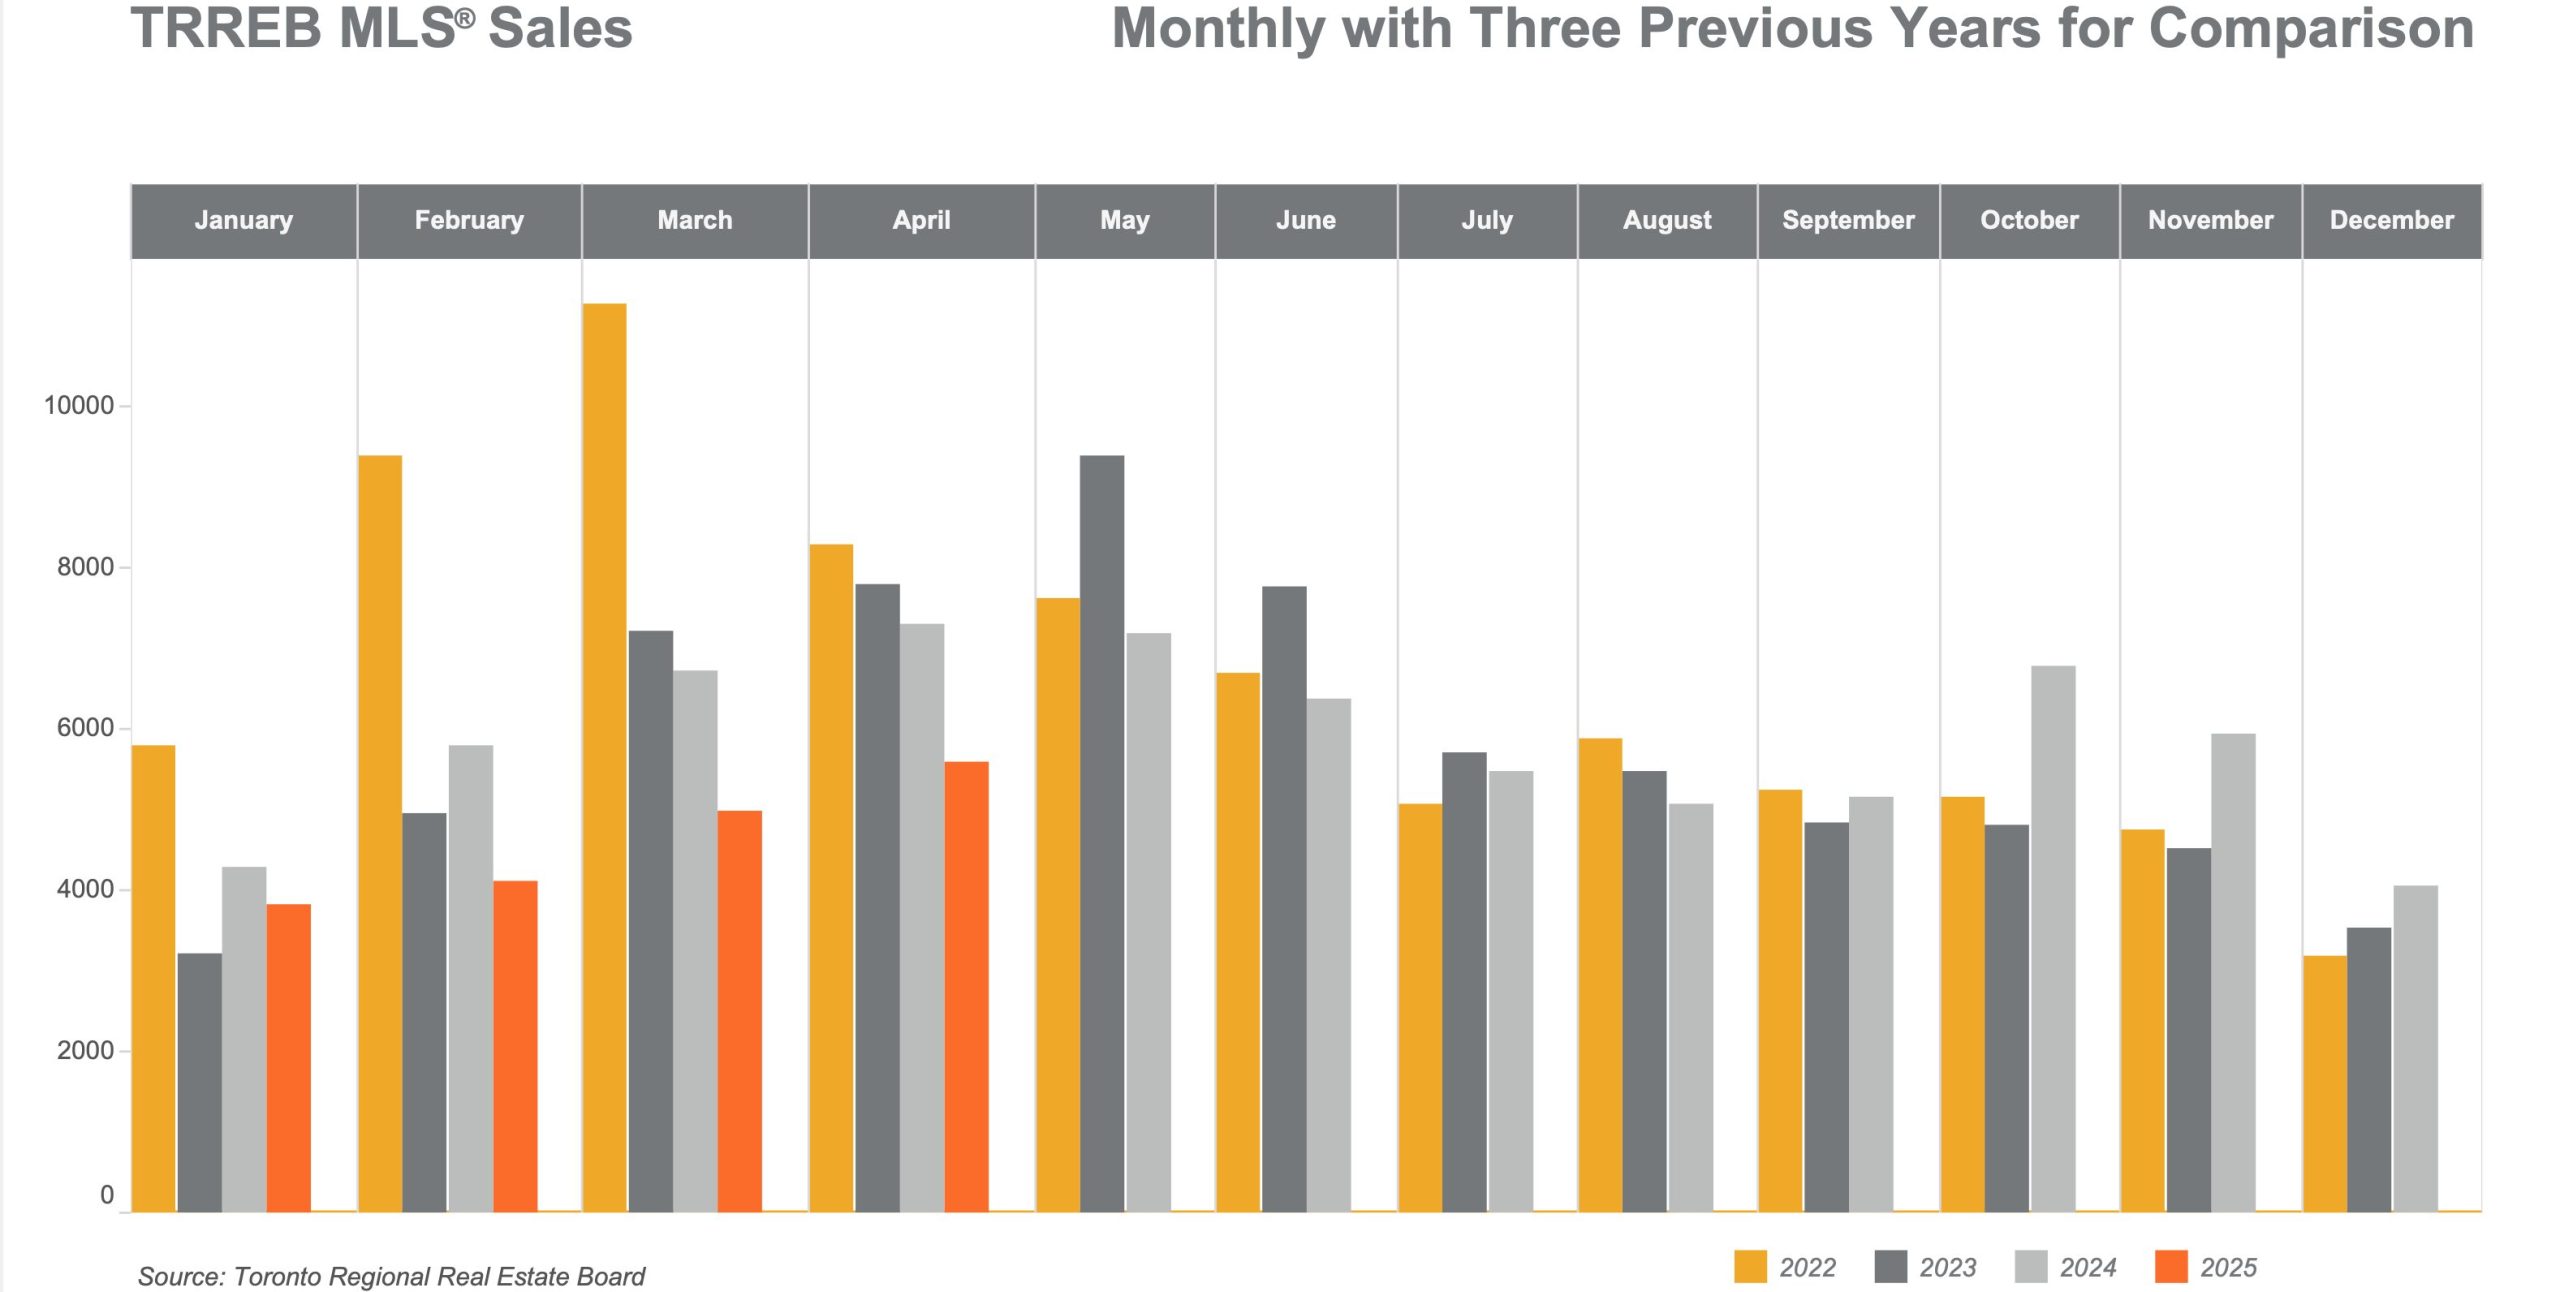
| Total Home Sales | 5,601 | 7,302 | -23.3% |
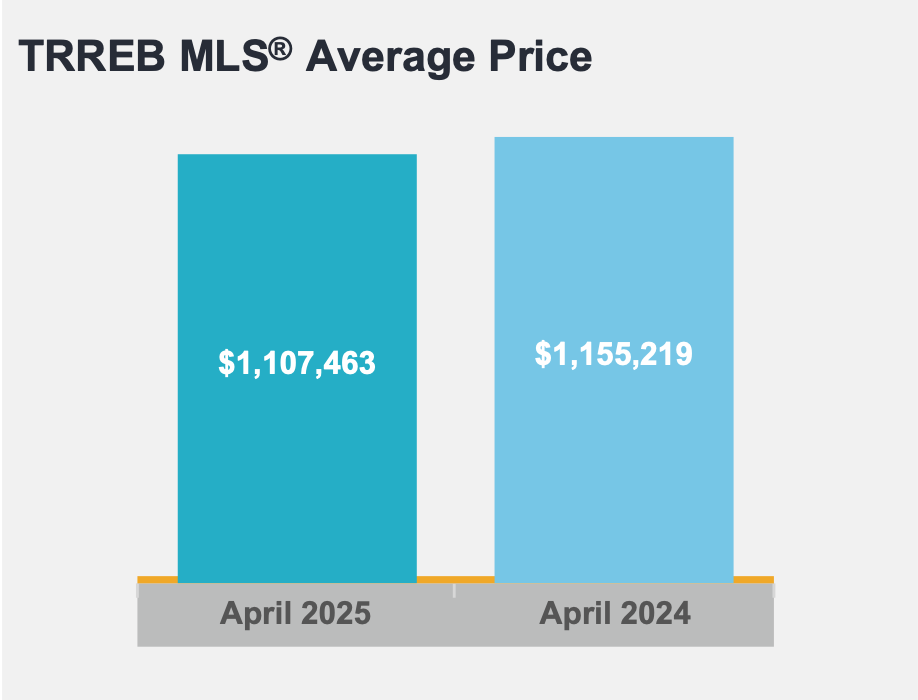
| Average Selling Price | $1,107,463 | $1,155,219 | -4.1% |
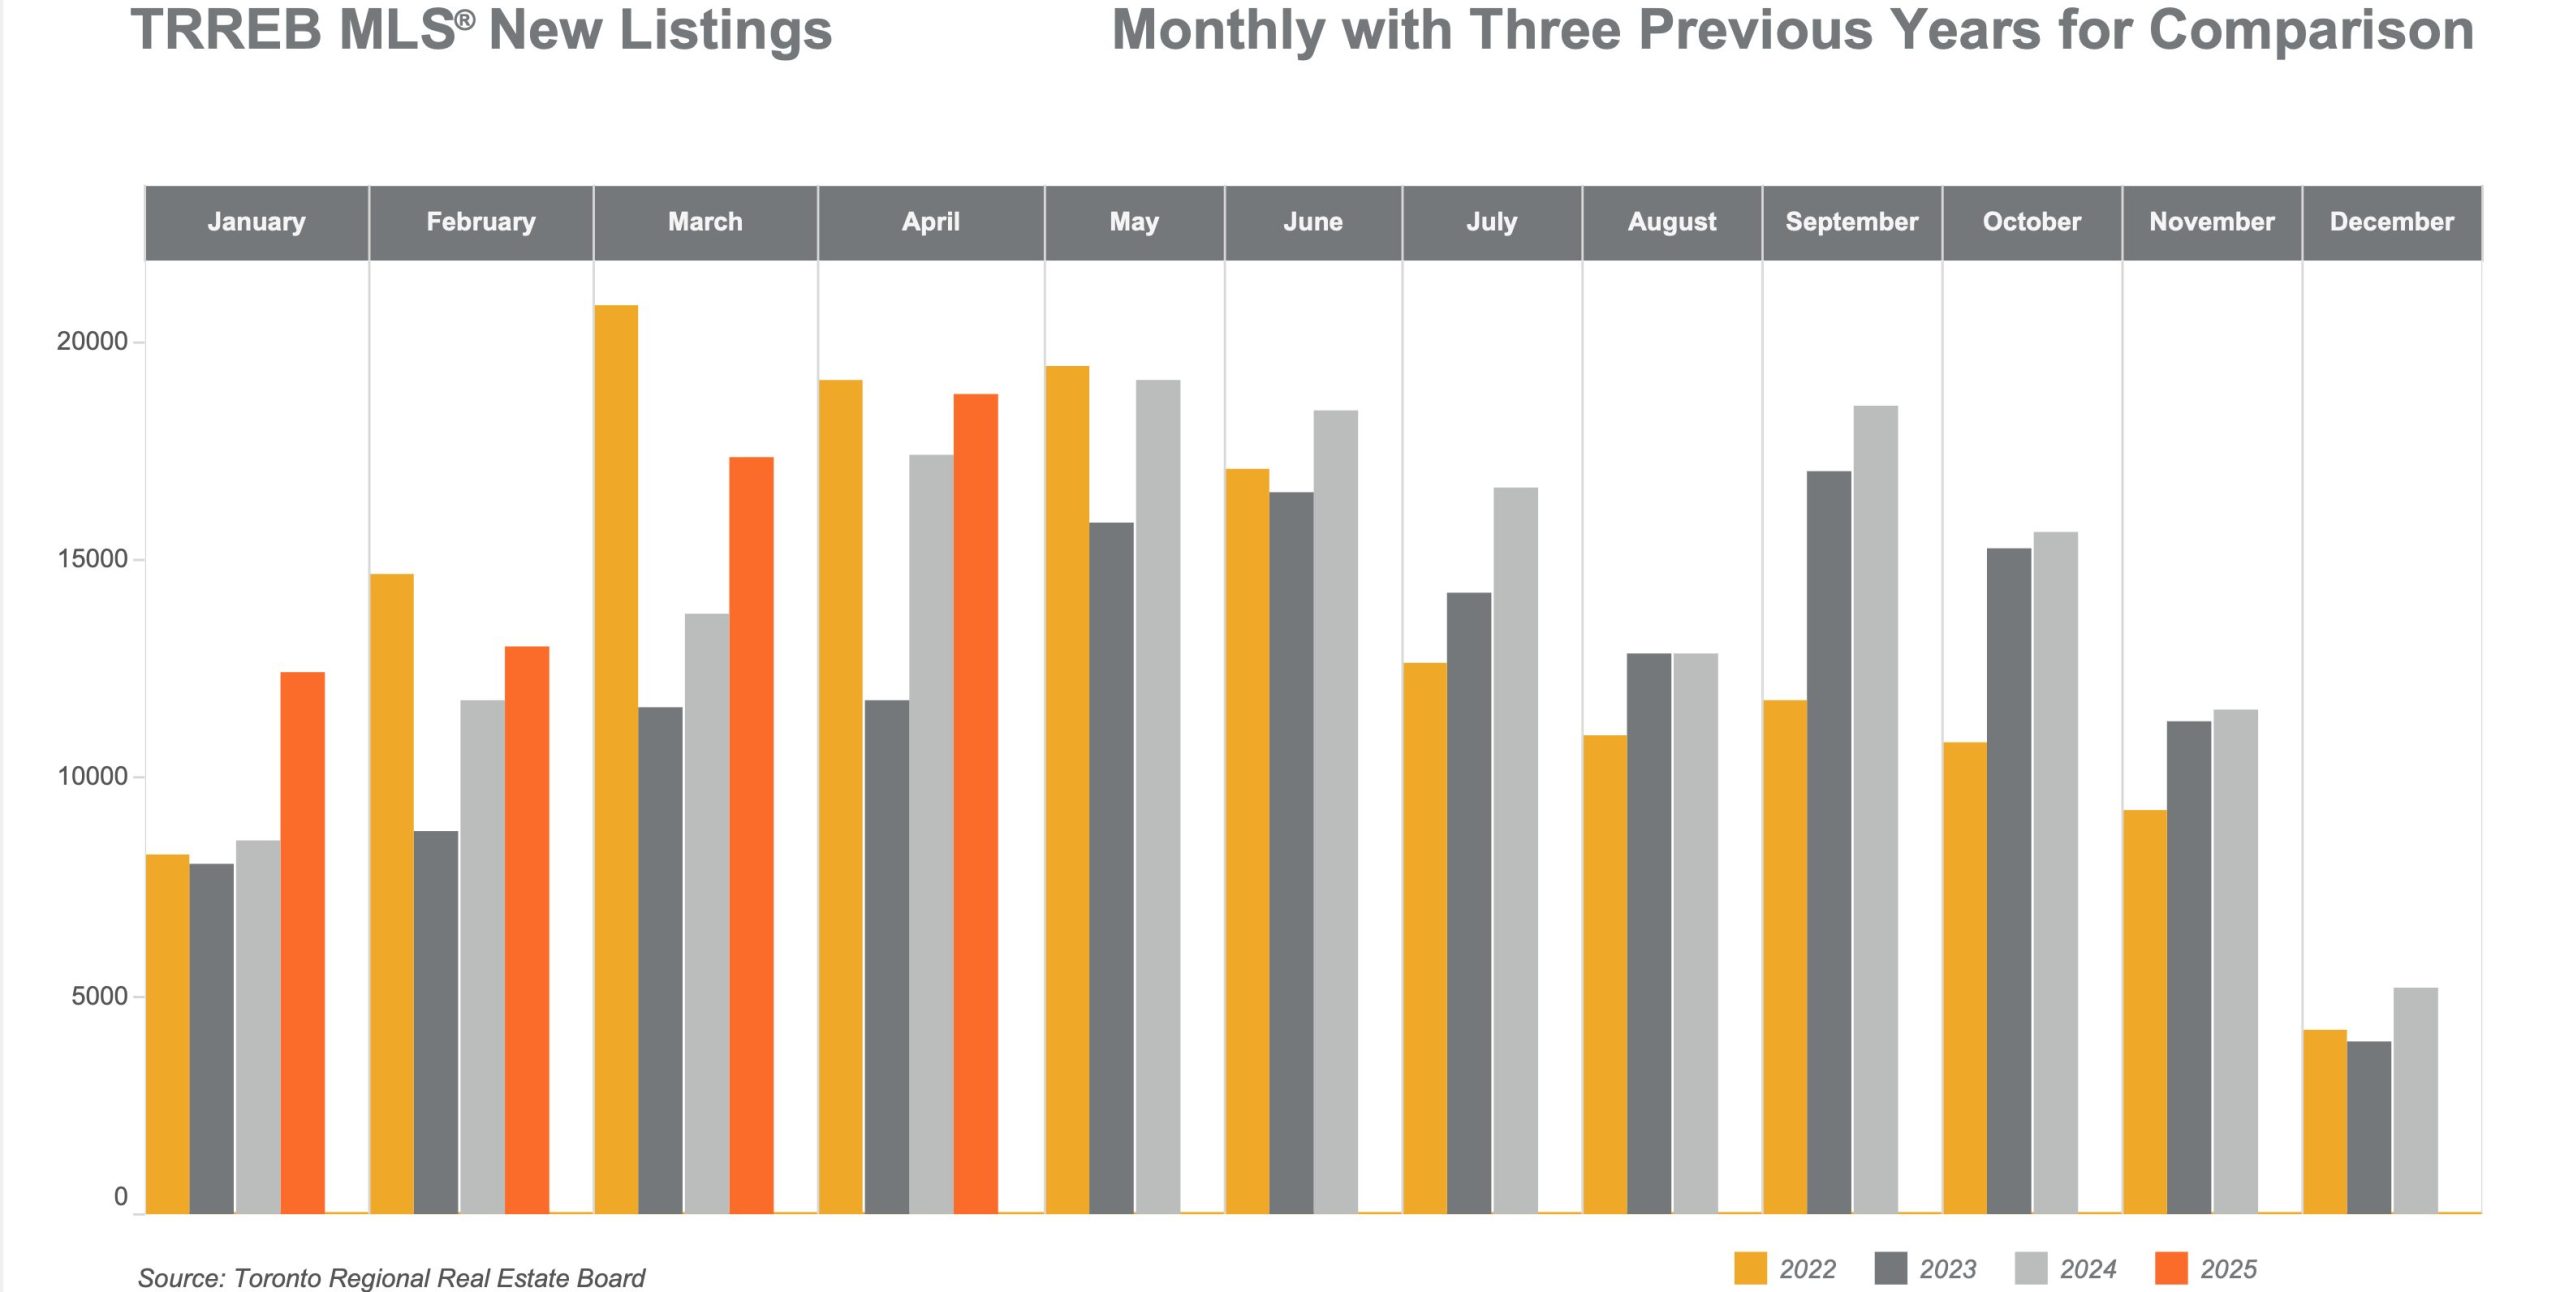
| New Listings | 18,836 | 17,418 | +8.1% |
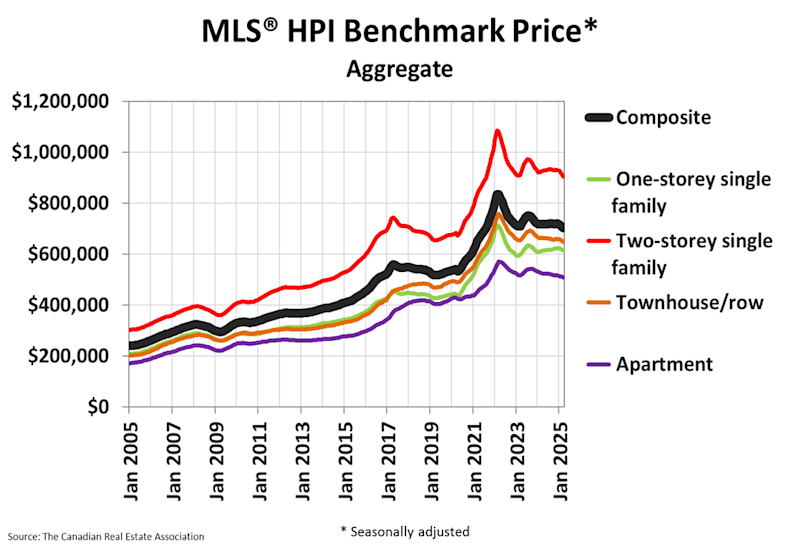
| MLS® HPI Composite Benchmark | — | — | -5.4% |
| Average Days on Market (LDOM) | 25 | 33 | Improved |
🏡 Breakdown by Housing Type
Here’s a detailed look at real estate sales and prices by home type across the 416 (Toronto) and 905 (suburban) areas.
📊 Sales & Average Price by Property Type
| Type | Sales
(416) |
Sales
(905) |
Total
Sales |
Avg Price
(416) |
Avg Price
(905) |
|---|---|---|---|---|---|
| Detached | 1,430.. | 2,556.. | 3,986.. | $1,431,495.. | $1,324,280.. |
| Semi-Detached. | 505 | 778 | 1,283 | $1,088,848 | $944,934 |
| Townhouse | 312 | 925 | 1,237 | $912,629 | $884,746 |
| Condo Apt | 983 | 728 | 1,711 | $678,048 | $618,196 |
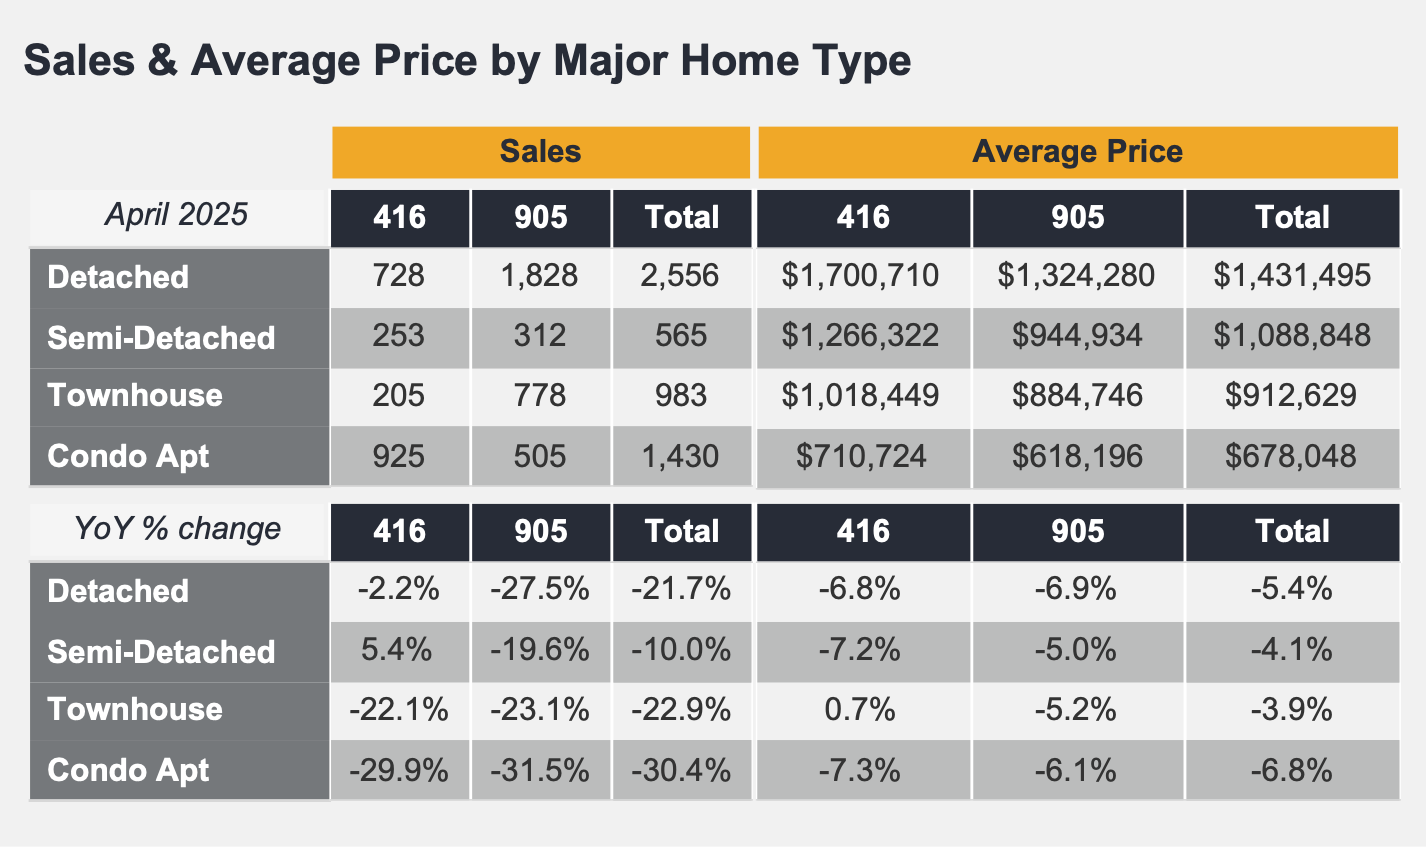
💬 Year-over-Year Price Change by Property Type
-
Detached: -6.9%
-
Semi-Detached: -5.0%
-
Townhouse: -5.2%
-
Condo Apartment: -6.1%
📉 Across all segments, buyers gained greater leverage due to elevated real estate inventory levels and improved affordability through moderated mortgage rates.
📉 What’s Behind the Dip in Sales?
Despite following a typical seasonal uptick from March, April 2025 real estate sales fell 23.3% year-over-year. This hesitation is largely attributed to:
-
High borrowing costs: Despite some moderation, the RATE HOLD! Bank of Canada Interest Rate Announcement – April 16, 2025.
-
Economic uncertainty: Following the federal election, many are monitoring the Canada-U.S. trade relationship, which may impact consumer confidence.
-
Improved inventory: Buyers now have more choices, leading to longer decision-making timelines.
📊 Economic Indicators Snapshot
| Indicator | Value | Trend |
|---|---|---|
| Inflation (CPI YoY) | 2.8%(Apr 2025) | ↑ from 2.3% Mar |
| Toronto Unemployment Rate | 5.0%(Apr 2025) | ↑ from 4.8% Mar |
| Bank of Canada Overnight Rate | 2.750% | ↔ steady |
| Prime Lending Rate | 6.45% | ↔ steady |
| 5-Year Fixed Mortgage Rate | 5.09% avg. | ↓ slightly |
🌍 Regional Trends: Urban vs. Suburban
The 905 regions (e.g., Durham, York, Peel) showed resilience in price stability while urban centers like Toronto (416) saw sharper price drops, especially in condo segments.
🏙 Toronto (416):
-
Condos down 6.1%
-
Detached prices remain highest at $1.43M
🏘 Suburbs (905):
-
Balanced activity
-
Greater affordability attracted more buyers despite market cooling
💡 What This Means for Buyers and Sellers
🧭 For Buyers:
-
More selection: Higher active real estate listings mean less competition
-
Negotiation power: Sellers are more flexible on price and conditions
-
properties with more backyard: More real estate inventory available just outside the core within 1-2 hour drive from Toronto
💼 For Sellers:
-
Be realistic with pricing
-
Market your home’s unique features, such as workshops or acreage
-
Professional evaluation is key: Pricing right the first time shortens DOM and maximizes ROI
📍 Spotlight: Properties With Backyard Space
There’s growing demand for properties with some backyard space and/or additional buildings, especially among buyers moving from subdivision homes in City Centers. If you’re thinking of selling and your property fits this profile, now may be the perfect time to connect with qualified buyers.
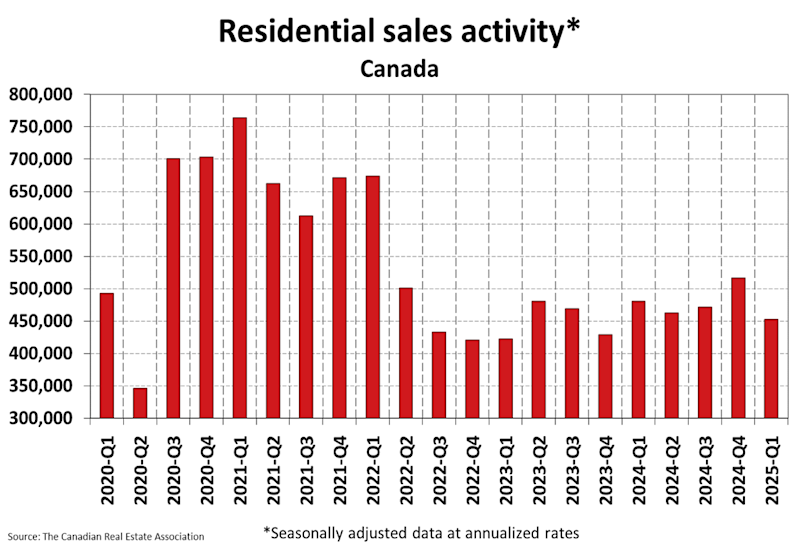
📈 Chart: TRREB Sales Activity YoY
Real Estate Sales are down, but opportunities are up for savvy buyers and well-prepared sellers.

🤝 Let’s Talk: Free Market Evaluation
If you’re wondering about your home’s value in today’s changing market, I offer a FREE, no-obligation market evaluation that can help you decide if now is the right time to sell.
Whether you’re staying local or heading outside of the city to York Region or Durham Region and the Kawarthas, I can guide your move with real insights and connections to active, qualified buyers.

Summary
In April 2025, the Greater Toronto Area (GTA) real estate market saw a continued seasonal rise in activity from March, but overall real estate sales remained significantly lower than the same period in 2024. TRREB reported a 23.3% year-over-year drop in home sales, with only 5,601 transactions completed.
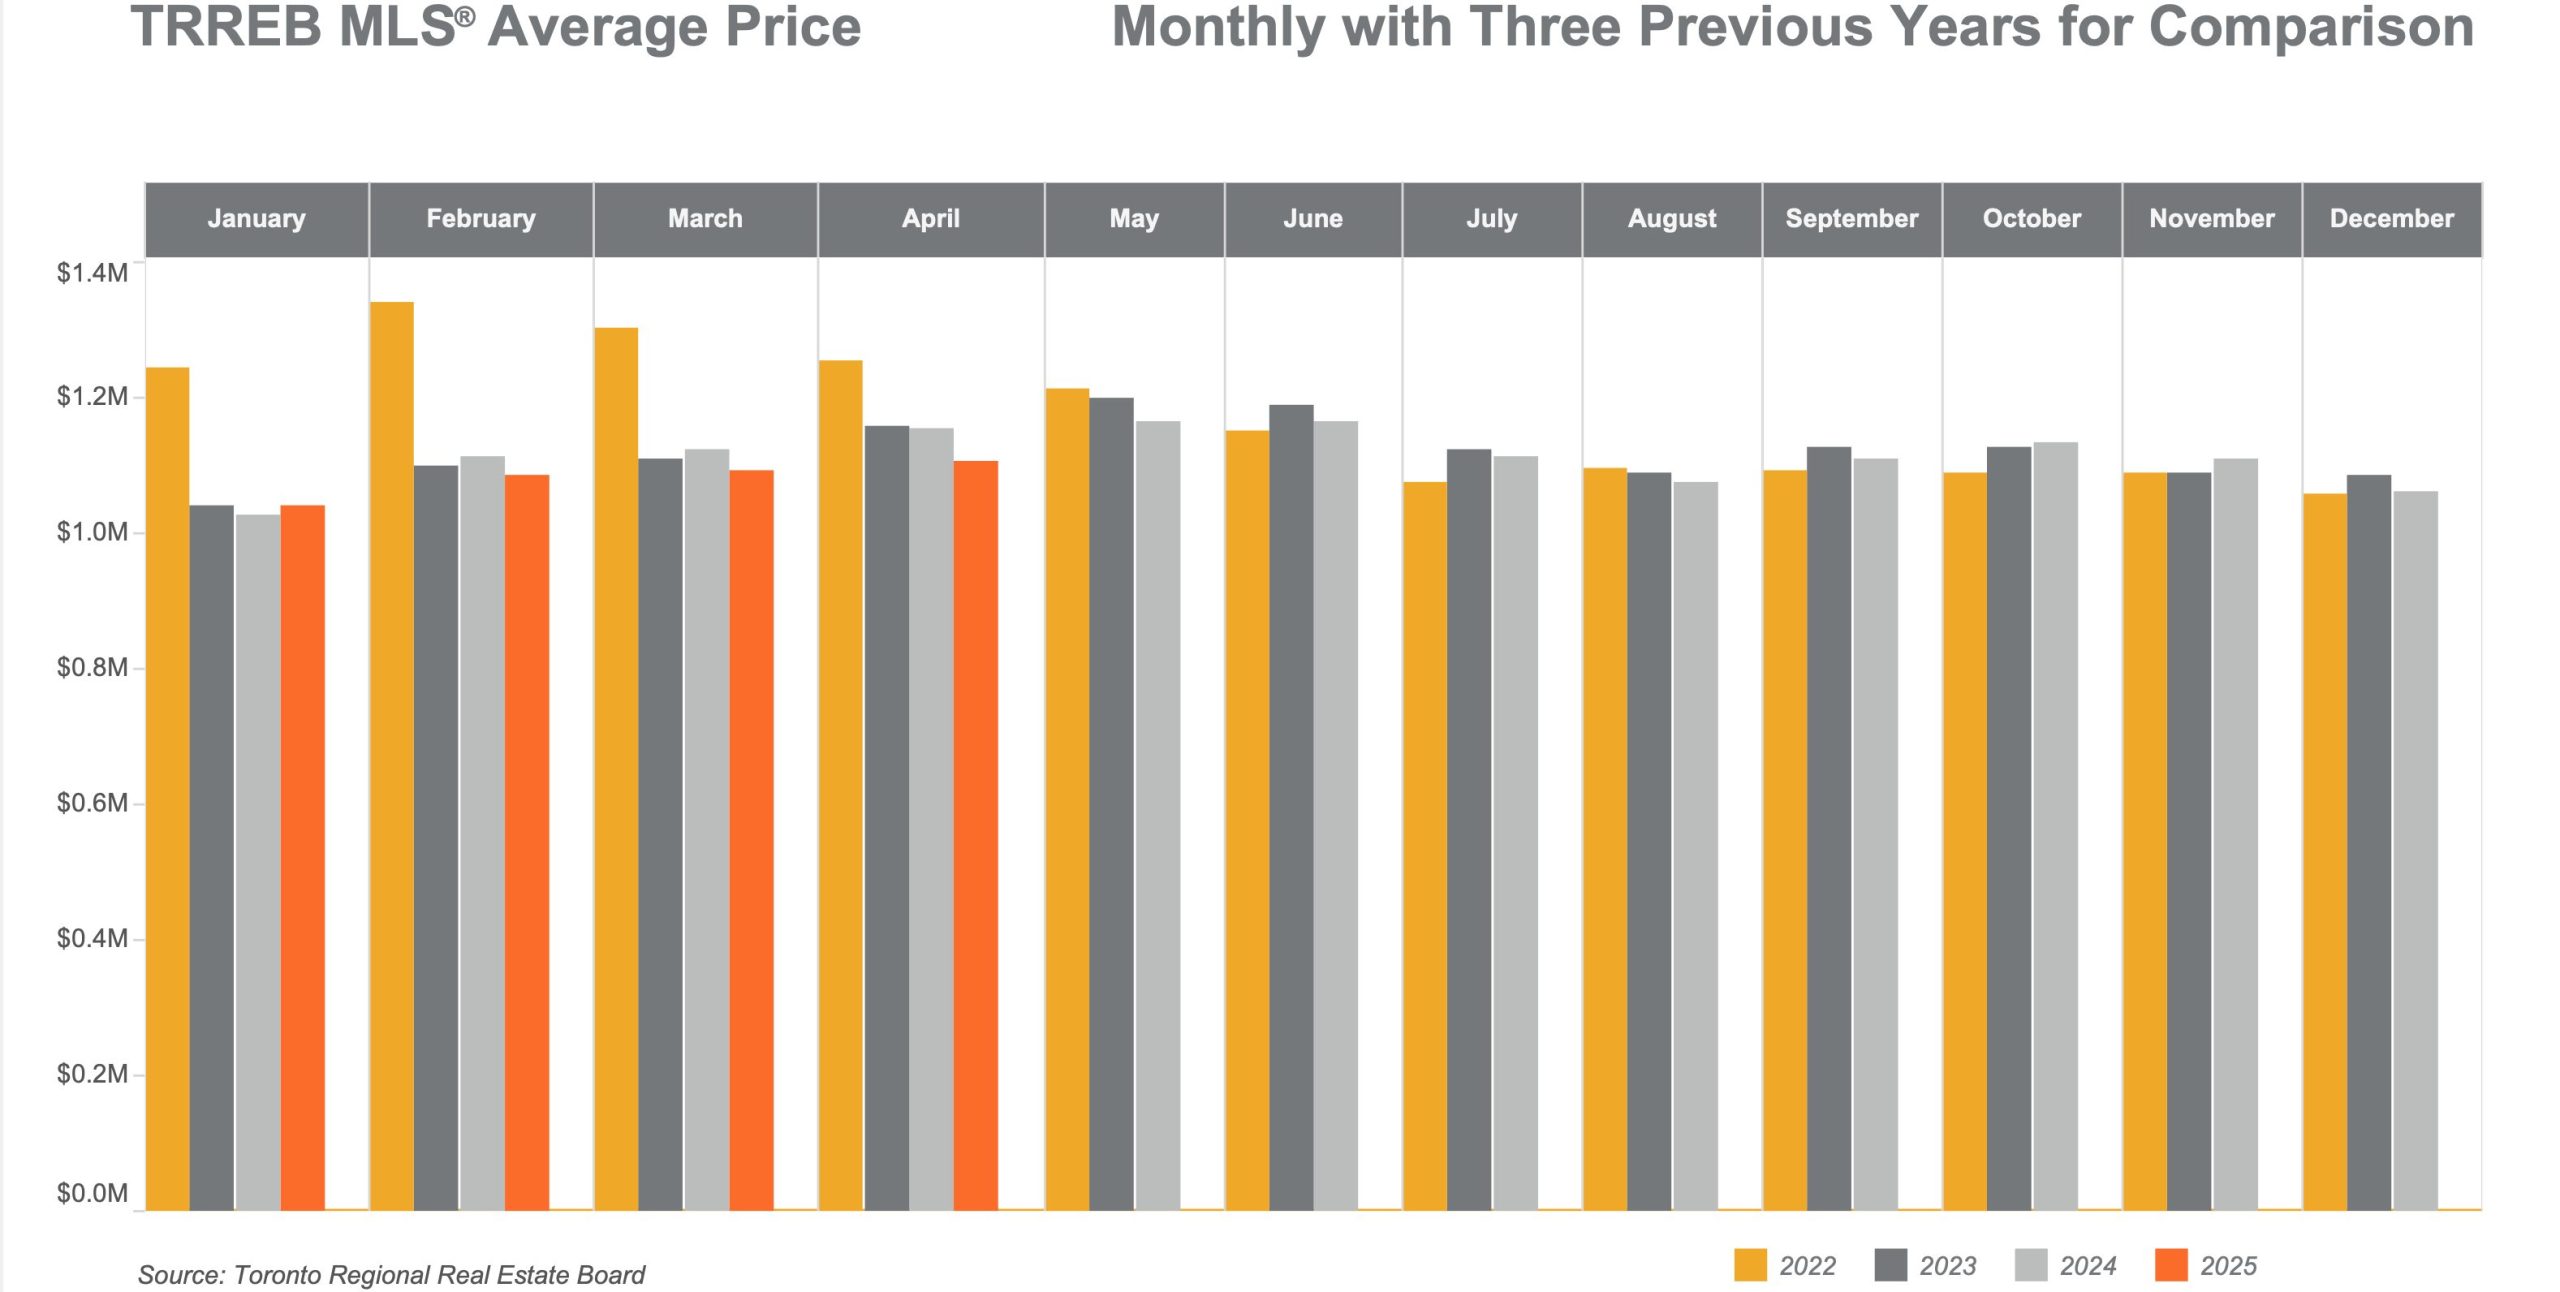
At the same time, new real estate listings rose by 8.1%, providing buyers with greater inventory and more negotiating power. The average home price fell by 4.1% to $1,107,463, while the MLS® Home Price Index Composite dropped 5.4% year-over-year, reflecting buyers’ cautious stance amid high borrowing costs and economic uncertainty following the recent federal election.
Elevated inventory and moderating mortgage rates contributed to more affordable housing options across the GTA. Detached, semi-detached, and condo apartment segments all experienced price declines, with detached homes in the 416 region averaging over $1.43 million.
Meanwhile, broader economic indicators showed continued inflation and employment growth, although real GDP growth remained uneven across timeframes. As households monitor developments in Canada’s trade relations and monetary policy, the GTA market is positioned for possible shifts in buyer sentiment should confidence improve and borrowing conditions ease.
❓ Frequently Asked Questions (FAQ)
1. Why are home sales down in April 2025?
Sales are lower largely due to buyer hesitation around high interest rates and economic uncertainty following the recent federal election and the ongoing trade war.
2. Is this a good time to buy real estate in the GTA?
Yes, if you’re financially ready. There’s less competition and more choice, giving buyers leverage in negotiations.
3. How can I make my home more attractive to buyers?
Highlight key features such as land, workshops, finished basements, or upgrades. Price competitively and stage professionally.
4. What’s the best area within an hour or two of Toronto to find land with buildings?
Areas north and east of York Region and Durham Region —such as Uxbridge, Clarington, Georgina, Brock, and parts of Kawartha Lakes—are growing in popularity among buyers looking for space and utility.
5. What’s the benefit of a free market evaluation?
It gives you an accurate sense of your home’s current market value, helping you plan with confidence. No strings attached.
📝 Final Thoughts
The GTA housing market is shifting, but with the right guidance, you can take full advantage of today’s conditions—whether you’re buying your dream rural property or selling your urban home.
📩 Let’s connect to discuss your goals and how I can help you navigate the market confidently.
 |
 |
 |
 |
 |
📌 Capital Gains in Canada: A Must-Read Guide for Real Estate Investors

Thinking about selling your rental or secondary property? Before you do, it’s critical to understand how capital gains tax can affect your bottom line. This guide explains what you need to know, what’s changed, and how to plan ahead.
Capital Gains in Canada: What Real Estate Investors Need to Know

Thinking about selling your rental or secondary property? Before you do, it’s critical to understand how capital gains tax can affect your bottom line. This guide explains what you need to know, what’s changed, and how to plan ahead.
Capital gains taxation is an important consideration for property owners and investors across Canada, particularly those holding secondary residences and rental properties.
Understanding how capital gains work, the implications for your tax obligations, and how strategic planning can mitigate liabilities is essential for making informed financial decisions.
What Are Capital Gains?

Capital gains occur when an asset, such as real estate, is sold for more than its adjusted cost base (ACB), which includes the purchase price plus certain costs like legal fees, renovations, and selling expenses.
In Canada, 50% of a capital gain is taxable and added to the seller’s income for the year. This is known as the capital gains inclusion rate.
For instance, if a property is sold for $1 million and the ACB is $600,000, the gain is $400,000, of which $200,000 would be taxable.
The Impact on Real Estate, Including Rental Properties

Real estate, especially rental properties and secondary residences, is subject to capital gains tax unless the property qualifies as a principal residence.
The principal residence exemption allows homeowners to shelter the full capital gain from tax if certain criteria are met.
However, secondary residences and rental properties do not qualify for this exemption.
When selling a rental property, the taxable portion of the gain is added to your total income, potentially pushing you into a higher tax bracket.
Additionally, if Capital Cost Allowance (CCA) was claimed on the property to offset rental income, a portion of that may be recaptured and taxed as income, not a capital gain.
This creates a tradeoff between the benefit of reducing taxes annually versus facing higher taxes upon sale.
Balancing Timing and Tax Efficiency

One of the key challenges for property owners is timing the sale of a secondary property. Selling in a year when your other income is lower can reduce the overall tax impact.
Conversely, selling during a high-income year could significantly increase your marginal tax rate, resulting in a larger tax bill.
Tax planning strategies can help balance this tradeoff:
- Deferring the sale to a year with lower income
- Using capital losses to offset gains
- Transferring ownership to a spouse in a lower tax bracket (with caution, due to attribution rules)
These strategies highlight the importance of personalized tax planning, particularly when dealing with sizable capital assets like real estate.
Looking Ahead: Potential Tax Changes

In the 2024 federal budget, the government announced its intention to increase the capital gains inclusion rate from 50% to 66.67% for gains over $250,000, effective January 1, 2026.
This would have had significant implications for investors holding high-value assets, especially real estate.
The proposed change introduced further complexity, requiring even more careful consideration of timing and asset disposition.
However, on March 21, 2025, Prime Minister Carney announced that the Government of Canada will cancel the proposed hike in the capital gains inclusion rate, maintaining the current 50% inclusion rate.
This decision has been welcomed by many in the investment and real estate sectors, as it preserves the current planning frameworks and alleviates concerns of increased tax burdens on large asset sales.
Real-World Example

Consider a scenario where an Ontario investor sells a secondary rental property for $1 million in 2025.
The original purchase price was $500,000, with $50,000 in eligible improvements and $40,000 in selling expenses, bringing the adjusted cost base to $590,000.
The capital gain is $410,000, and 50%—or $205,000—is taxable. Assuming the seller falls into the 33% marginal tax bracket, the tax owing on the gain could be approximately $67,650.
Had the proposed inclusion rate increase to 66.67% been implemented in 2026, the taxable portion would have been $273,347, with an estimated tax burden closer to $90,000—illustrating the significant impact such a policy change could have had.
Making Informed Decisions

The decision to sell a secondary residence or rental property in Canada carries notable tax consequences. Capital gains tax, while only applied to 50% of the gain (for now), can substantially affect your net proceeds. Properly accounting for selling expenses, potential CCA recapture, and the timing of the sale are all vital to reducing your tax liability.
For real estate investors, the key lies in understanding how the rules apply, what tradeoffs exist, and how to plan effectively. Working with a financial advisor or tax professional can help navigate these complexities, ensuring that your investment decisions align with both your financial goals and the tax landscape.
Need personalized guidance? Contact Gerald Lawrence to book a private consultation and learn how to maximize your returns when selling investment properties.
📄 For a Downloadable Guide (PDF format):
Your Guide to Capital Gains Tax in Canadian Real Estate
Understand the Rules, Avoid the Pitfalls, and Maximize Your Profits
Presented by: Gerald Lawrence, REALTOR® | www.GeraldLawrence.Realtor – Coldwell Banker R.M.R. Real Estate, Brokerage
